Summary
DOI: 10.1373/clinchem.2010.150425
A 90-year-old man who had a history of transurethral prostate resection for benign prostatic hyperplasia was admitted for left hip pain. A hip radiography examination revealed a large osteolytic lesion in the left greater trochanter, and a bone scintigraphy evaluation showed increased activity in the same area. Because of the patient's history, metastasis from prostate carcinoma was suspected, and bone biopsies were performed the same week. Ten days later, the patient was hospitalized in the emergency department after a fall that fractured the femoral neck. At admission, plasma sodium, chloride, and potassium concentrations were all within their respective reference intervals.
Student Discussion
Student Discussion Document (pdf)
Benoit Busser,1* Sylvain Millet,2 Claude Eric Bulabois,3 Patrice Faure,1 and Jean Charles Renversez1
1Département de Biochimie, Toxicologie, Pharmacologie, Pôle de Biologie, CHU Grenoble, Grenoble, France; 2Département d’Hématologie, Onco-Génétique et Immunologie, Pôle de Biologie, CHU Grenoble, Grenoble, France; 3Unité de Soins Intensifs d’Hématologie, Pôle de Cancérologie et d’Hématologie, CHU Grenoble, Grenoble, France.
*Address correspondence to this author at: Département de Biochimie, Toxicologie, Pharmacologie, CHU Grenoble BP217, 38042 Grenoble Cedex 09, France. Fax: +33-4-76-76-51-81; e-mail [email protected].
Case Description
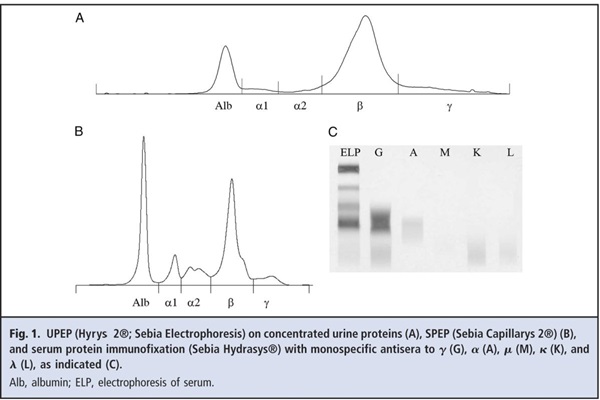
A 90-year-old man who had a history of transurethral prostate resection for benign prostatic hyperplasia was admitted for left hip pain. A hip radiography examination revealed a large osteolytic lesion in the left greater trochanter, and a bone scintigraphy evaluation showed increased activity in the same area. Because of the patient’s history, metastasis from prostate carcinoma was suspected, and bone biopsies were performed the same week. Ten days later, the patient was hospitalized in the emergency department after a fall that fractured the femoral neck. At admission, plasma sodium, chloride, and potassium concentrations were all within their respective reference intervals. The plasma concentration of total protein was 5.0 g/dL (50 g/L) [reference interval, 6.0–8.0 g/dL (60–80 g/L)], and that of albumin was 1.5 g/dL (15 g/L) [reference interval, 3.0–4.5 g/dL (30–45 g/L)]. The albumin-corrected calcium concentration was 10.8 mg/dL (2.69 mmol/L) [reference interval, 9.0–10.6 mg/dL (2.25–2.65 mmol/L)]. Hematology tests showed mild normocytic (mean corpuscular volume, 95.1 fL; reference interval, 80–97 fL]), aregenerative [reticulocyte count, 54 × 103/μL (54 × 109/L); reference interval, 25–80 × 103/μL (25–80 × 109/L)] anemia, with a low hemoglobin concentration [9.9 g/dL (99 g/L); reference interval, 13.0–17.0 g/dL (130–170 g/L)] and leukopenia [2.5 × 10³/μL (2.5 × 10⁹/L); reference interval, 4.0–10.0 × 10³/μL (4.0–10.0 × 10⁹/L)]. The plasma creatinine value was 1.1 mg/dL (97μmol/L) [reference interval, 0.71–1.20 mg/dL (62–106 μmol/L)], and the urea nitrogen concentration was 35.0 mg/dL (12.5 mmol/L) [reference interval, 7.8–19.6 mg/dL (2.8–7.0 mmol/L)]. The urine protein value was 540 mg/24 h (reference interval, 0–150 mg/24 h). Urine protein electrophoresis (UPEP) showed the presence of an unusual spike in the β region (Fig. 1A). We measured an increased urine concentration of free κ light chain [1.4 mg/dL (14 mg/L); reference interval, 0–0.2 mg/dL (0–2 mg/L)], along with a normal concentration of urine β2- microglobulin.
The patient underwent surgical repair of his left femur. In the meantime, our laboratory asked for serum to complete the investigation of the abnormal UPEP pattern. Investigations of the serum sample revealed a decreased albumin concentration [1.45 g/dL (14.5 g/L); reference interval, 3.0–4.5 g/dL (30–45 g/L)]. Immunoglobulin quantification revealed an increased IgG value [2950 mg/dL (29.5 g/L); reference interval, 700–1000 mg/dL (7–10 g/L)]. IgA and IgM were within their respective reference intervals. Serum protein electrophoresis (SPEP) showed an increased α1 region, along with decreased albumin and γ regions. Moreover, we found an increased β region (19.1 g/L, quantified from the electrophoresis trace and the total protein concentration), along with a loss of separation between the β1 and β2 regions because of a narrow spike (Fig. 1B). With a normal concentration of β-globulins of approximately 300 mg/dL (3 g/L), we estimated the monoclonal protein concentration at approximately 1600 mg/dL (16 g/L). Serum immunofixation was performed with antibodies specific for heavy chains (G, A, M) and light chains (κ, λ). A band was present in the IgG lane with a β electrophoretic mobility, with no corresponding band for the light chain (Fig. 1C). Serum free light chains included a decreased free κ chain [0.06 mg/dL (0.6 mg/L); reference interval, 0.33–1.94 mg/dL (3.3–19.4 mg/L)], a decreased free λ chain [0.045 mg/dL (0.45 mg/L); reference interval, 0.57–2.63 mg/dL (5.7–26.3 mg/L)], and a normal κ/λ ratio of 1.33 (reference interval, 0.26–1.65). The results of IgG subclass quantification were as follows: IgG1, 768 mg/dL (7.68 g/L) [reference interval, 500–800 mg/dL (5–8 g/L)]; IgG2,<9.0 mg/dL (<0.09 g/L) [reference interval, 90–300 mg/dL (0.9–3 g/L)]; IgG3, 23.0 mg/dL (0.23 g/L) [reference interval, 10–80 mg/dL (0.1–0.8 g/L)]; and IgG4, 1.0 mg/dL (0.01 g/L) [reference interval, 10–60 mg/dL (0.1–0.6 g/L)].
Questions to Consider
- What are the potential causes of increased β-globulins?
- What can explain the discrepancy between the presence of κ light chains in the urine and the presence of a monoclonal IgG without light chains in the serum?
- What investigations should be performed to characterize the protein responsible for the spike in the β region of the UPEP results?
- What can explain the observation that the sum of the 4 IgG subclasses [<800 mg/dL (<8 g/L)] was not equal to the total IgG concentration [2950 mg/dL (29.5 g/L)]?
Final Publication and Comments
The final published version with discussion and comments from the experts appears
in the July 2011 issue of Clinical Chemistry, approximately 3-4 weeks after the Student Discussion is posted.
Educational Centers
If you are associated with an educational center and would like to receive the cases and
questions 3-4 weeks in advance of publication, please email [email protected].
AACC is pleased to allow free reproduction and distribution of this Clinical Case
Study for personal or classroom discussion use. When photocopying, please make sure
the DOI and copyright notice appear on each copy.
DOI: 10.1373/clinchem.2010.150425
Copyright © 2011 American Association for Clinical Chemistry