Many institutions have laboratory stewardship programs that aim to improve ordering, retrieval, and interpretation of laboratory tests, while also developing and maintaining systems to provide appropriate financial coverage (1). However, the complexities of our current healthcare system can make this vision feel overwhelming or unattainable, even for the most advanced laboratory stewardship programs.
Institutions can use benchmarking to determine the best opportunities for improving stewardship. Using this technique, an institution compares its performance against peers or a recognized best practice. The literature is relatively sparse, with only a few examples demonstrating this approach for laboratory stewardship.
In one example, Signorelli, et al., examined vitamin D ordering across 30 institutions to demonstrate practice variation and found that the mean ratio of 1,25 dihydroxyvitamin D to 25 hydroxyvitamin D was 1:18 (2). Another study established benchmarks based on Choosing Wisely recommendations using common lab tests (e.g., sodium) to normalize for comparison (3).
When evaluating a practice against a benchmark based on peer data, as opposed to an evidence-based practice standard, there are two important considerations. First, the laboratory will need to account for differences in patient population (e.g., pediatrics, inpatient, community practice). Second, gathering, collating, and sharing data with participants is resource intensive.
PLUGS (Patient-Centered Laboratory Utilization Guidance Services) has created an Informatics Tools Working Group to address this gap.
Creating Benchmark Metrics
The first task for the PLUGS informatics subcommittee was to identify a set of metrics to develop. The ideal metric needed to meet three basic criteria. First, it needed to be a common opportunity for utilization efforts. Common opportunities were based on the subcommittee’s expertise and experience, as well as review of published literature or other clinical evidence-based guidelines. Second, the subcommittee wanted metrics defined by discreet data that could be extracted from a laboratory-based data warehouse, such as a laboratory’s local laboratory information system (LIS). Third, the metric needed to enable a laboratory to create a single calculated value from the collected data that was simple enough to be managed in readily available software such as Microsoft Excel.
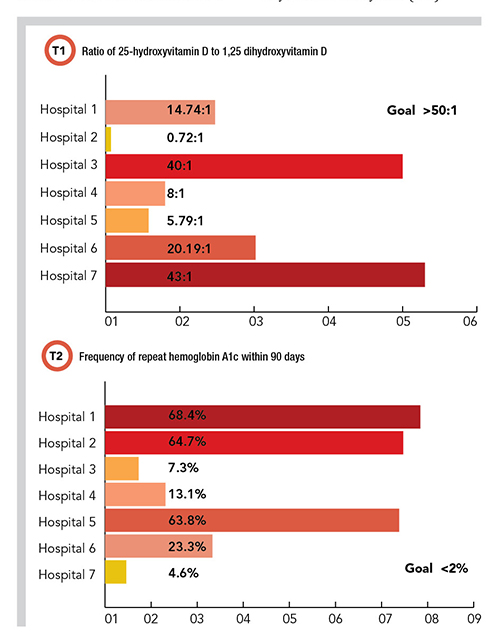
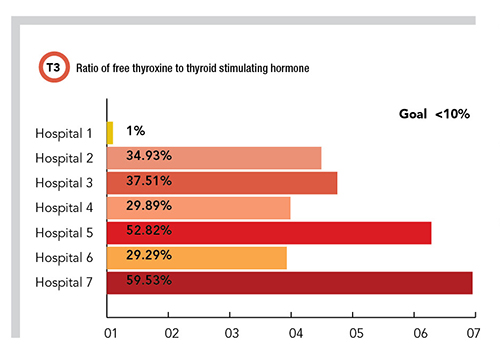
Using these criteria as a guide, the PLUGS informatics subcommittee identified more than 20 potential metric targets. For a pilot study, the subcommittee developed three of these metrics so that laboratories could quickly assess their own data to determine if an intervention was warranted. The subcommittee also wrote specific instructions on how to retrieve the data and how to calculate the actual metric itself. The three benchmarks focused on vitamin D, hemoglobin A1c (HbA1c), and the ratio of free thyroxine (FT4) to thyroid stimulating hormone (TSH).
For 25-hydroxyvitamin D/1,25 dihydroxyvitamin D the benchmark was set at 50:1, meaning if there are less than 50 25-hydroxyvitamin D orders for every 1,25 dihydroxyvitamin D order, then 1,25 dihydroxyvitamin D may be ordered too frequently (and possibly incorrectly), requiring the institution to further evaluate. For the frequency of repeat HbA1c within 90 days, the benchmark was set at <2%, meaning if there are more than 2% of HbA1c orders being repeated within 90 days on the same patient, then that institution may be ordering HbA1c testing too frequently, requiring further scrutiny and potential intervention. For the ratio of FT4 to TSH, the benchmark was set at <10%, meaning if more than 10% of the total orders are FT4, then that institution may be ordering FT4 testing too frequently or incorrectly, requiring further scrutiny and potential intervention.
Pilot Study Results
With the three metrics identified and specific instructions in hand, the PLUGS informatics subcommittee members reviewed their own institution’s data to compare with the metrics. For the first metric, the resulting ratios of 25-hydroxyvitamin D to 1,25-dihydroxyvitamin D ranged from 0.7:1 to 45:1 across the participating institutions (Table 1). For the second benchmark, the frequency of HbA1c repeat testing order within 90 days ranged from 4.33% to 68.43%. For the third benchmark, the ratio of FT4 order sum to TSH order sum ranged from 1% to 59.53%.
In looking at the results of the pilot study, it’s important to note that some of these institutions had well established interventions to control the utilization of one or more of these testing metrics, whereas others had none. Whether institutions had these preexisting interventions appears to correlate with the data obtained, with those institutions that had stronger interventions showing better outcomes against the relevant metric.
Adding and Refining Benchmarks
This pilot program is an early attempt at creating benchmarks for specific laboratory stewardship opportunities. There are inherent limitations with benchmarks designed from examining practice variation, and more work is needed in this field to develop and validate evidence-based benchmarks.
In the meantime, this committee plans to identify more targeted metrics to define additional benchmarks and continue to build out the existing three protocols by gathering data from more laboratories.
Further work will focus on assisting laboratories that aren’t meeting the benchmarks in deploying targeted interventions that can help them improve. Because these metrics can be reanalyzed before and after an intervention is developed, laboratories can rapidly assess improvement in a systematic and efficient manner.
Alec Saitman, PhD, DABCC, is the technical director of the core laboratory at Providence Regional Laboratories in Portland, Oregon. +Email: [email protected]
Jane Dickerson, PhD, DABCC, is clinical associate professor at the University of Washington. She is division head of laboratory medicine, and medical director of chemistry and reference lab services at Seattle Children’s Hospital. +Email: [email protected]
References
1.Dickerson JA, Fletcher AH, Procop G, et al. Transforming laboratory utilization review into laboratory stewardship: Guidelines by the PLUGS National Committee for Laboratory Stewardship. J Appl Lab Med 2017;2:259-68.
2.Signorelli H, Straseski JA, Genzen JR, et al. Benchmarking to identify practice variation in test ordering: A potential tool for utilization management. Lab Med 2015;46:356-64.
3.Bevins NJ, Luevano DR, Nuspl R, et al. Test volume ratio benchmarking to identify and reduce low-value laboratory utilization. Am J Clin Pathol 2021;156:708-14.