
Like many other industries, clinical laboratories are becoming more reliant on data analytics. Clinical laboratories generate, process, and store transactional data with high quality and efficiency. These data are required for patient care and quality assurance activities and increasingly are used for operational decisions. To analyze all these data, laboratories often rely on commercial spreadsheets or other specialized software applications. However, these programs can be functionally limited and often are not suitable for more complex statistical analyses and visualizations or for analysis of large or high-dimensional datasets. Importantly, the analysis and visualization workflows in these programs have limited reproducibility and transparency.
In contrast, R is a comprehensive, open source, platform-independent, freely available programming language, and it has a massive, worldwide user and contributor base. These characteristics make R ideally suited for clinical laboratorians. Applications of R in medicine—and specifically among clinical laboratorians—are growing due to increased visibility of R’s versatility and the availability of relevant, focused training.
Tools for almost any conceivable application have been written in R and publicly shared, enabling adaptation to a variety of user interests. Further, analyses carried out with R are highly customizable, reproducible, and can be automated. R is heavily utilized for its graphic and reporting capabilities, including the ability to render publication-quality figures with interactivity and to generate web-based dashboards and other reports in a variety of formats.
What Is R, and What Are Its Benefits?
As a statistical programming language, R allows laboratorians and others to transform and analyze data and communicate results. It includes a wide variety of capabilities that provide greater functionality for working with data than Microsoft Excel and other commercial data analysis programs. R uses text-based commands to process data, and as such it functions as a full-fledged programming language for the advanced user.
Unlike Excel and many other graphical user interface (GUI)-based programs, R’s reliance on text-based structure makes it straightforward to review at any time the commands used in a data processing pipeline to ensure that the correct steps were taken. Furthermore, the ability to view the underlying commands facilitates transparency and reproducibility of analyses.
The same text commands are used regardless of the size of the dataset; thus, it is just as easy for the user to perform an analysis on 1 million test results as it is to perform that analysis on 10 results. This feature makes it simple to automate and scale any process with R. In addition, the graphing capabilities of R far surpass that of Excel and many other GUI-based programs, in both functionality and potential for customization and automation.
Getting Started With R Programming
Though users can program with R from the command-line interface of a computer, it is common to use an integrated development environment (IDE) like RStudio. RStudio provides a cross-platform (i.e., works the same on Windows and Mac) graphical interface to write and execute code and to configure and manage components of R environments, including data, plots, results, versions, and packages. Similar to other IDEs, RStudio includes several features that make writing and debugging code easier and more efficient. And unlike some other IDEs, it offers smooth integration with tools for interactive documentation and dynamic report generation in a variety of formats (e.g., .doc, .pdf, .html).
Five Key Attributes of R
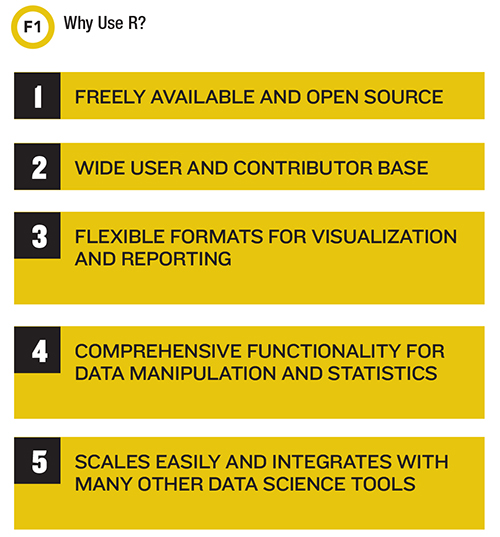
Open Source
As R software is freely available and open source, clinical laboratorians can download it at no charge and deploy it widely in their labs or hospital systems without any licensing fees. Open source means that the underlying code for R can be downloaded and, in principle, edited if necessary. This is important because it ensures that R does not depend on a commercial entity for bug fixes and empowers a large population of developers who are able to audit the underlying code, minimizing the chance for security issues or other source code errors and ensuring ongoing development of the software. Open source software also allows any suitably skilled individual to examine exactly how the software works, rather than relying on it as a “black box.” While the continued evolution and enhancement of the code base can create compatibility issues over time, programmers offer packages and workflows designed to help with this issue.
A Broad-Based Community of Users
R is widely used and supported within statistical communities and data-driven industries. Given the rapid pace of development in analytical techniques, such as machine learning or artificial intelligence, it is important that software packages continually evolve. The two dominant choices for data science as of this writing are R and Python (also freely available), and in both cases it is now possible to adapt code developed on one platform to run on the other. Consequently, for almost any statistical method, new or old, there is likely at least one freely available add-on package to implement it within the R environment. These packages are available on popular software-hosting sites, including the Comprehensive R Archive Network (CRAN; https://cran.r-project.org/) and GitHub.
As one example, Holmes and Buhr have recently published work related to extracting reference intervals from laboratory results (1). While they developed a corrected version of the traditional Hoffmann method that runs in R, they were also able to easily implement a statistically superior (and more algorithmically complex) approach using mixture modeling based on freely available code. The ability to use superior, more accurate statistical methods by taking advantage of the massive repository of available add-on packages is a significant advantage for laboratorians.
Importantly, the R community is recognized for its purposeful inclusivity, both in welcoming diversity among members and in fostering new members’ ability to learn the language.
Integrated Tools for Sharing Results
R provides a number of convenient tools for sharing and communicating results with dynamic reporting and the potential for interactivity. In particular, R supports the development of web-based dashboards and user interfaces and applications. There are several methods for creating graphics interfaces in R, including Shiny, a package for creating general web-based interfaces to R programs.
Among other things, these methods make it possible for a laboratorian to develop interactive business intelligence-style dashboards for operational management that would otherwise require commercial software, such as Tableau or QlikView. Custom R-based reports can be widely deployed for use by members of a laboratory who do not have any knowledge of R programming and do not have R installed.
With R, a laboratorian can also readily turn analyses into presentations or high-quality documents. Analysis and reporting can also be automated to occur on a user-defined schedule (i.e., every day at 8 a.m.).
A Perfect Fit for Clinical Laboratory Data
R is ideally suited for the type of data that clinical laboratories typically generate. Most lab datasets are structured in a rectangular format, meaning that variables are in different columns, and samples are in rows. For example, a typical laboratory information system data report might show a different patient result on each row, while columns would list test date and time, patient identification, test name, result, units, reference range, and other data. This format is routinely handled in R as a data frame, and many native tools have been provided in R for processing such data.
Even if raw data are not optimally formatted, R excels at transforming data from a variety of formats into rectangular data frames. In fact, some of the most prominent R packages developed over the past few years (the so-called tidyverse packages for dealing with tidy data) are optimized to import, structure, transform, summarize, model, plot, and communicate these types of datasets (2). As a result, laboratorians can more easily perform frequently-conducted laboratory data processing tasks, from generating turnaround time reports to looking at global distributions of results by assay. Moreover, they can share results in PDF reports, interactive dashboards, or other formats. R is also heavily utilized in high dimensional data analyses, common to ’omics, because of its comprehensive and cutting-edge package library of statistical methods. This includes packages specifically built for genomics (e.g., Bioconductor project) and metabolomics (e.g., XCMS, MetaboAnalyst).
Reliable Scalability
R can be scaled for use across the entire healthcare enterprise—from one person downloading it on a personal laptop or workstation to a group of laboratorians, clinicians, or analysts who want to collaborate on a large project. Similarly, if an institution wishes to implement a bioinformatic pipeline or make Shiny dashboards available organization-wide, commercially supported tools and services can be purchased to enable these workflows.
R integrates seamlessly with many other popular data science technologies (e.g., Python, SQL, Spark, TensorFlow, Microsoft PowerBI, GitHub, etc.). Thus, learning R provides a foundation for creating a wide variety of tools that can be scaled anywhere from an individual user to system-wide clinical deployment of a complete data science pipeline.
Examples of R Applications in Clinical Laboratories
Laboratorians have developed R packages to perform many of the routine tasks of assay validation without using commercial software. In addition, R is ideal for many of the calculations and data processing steps that are repeatedly performed in a clinical laboratory.
Suppose, for example, that administrators require that a laboratory report its annual test volumes year-by-year. Using conventional tools like Excel, this can be a time-consuming, error-prone task involving many copy-paste steps with questionable reproducibility and opaque decision-making. Navigating a very large file using Excel may itself be a problem. In contrast, R handles such files with ease, limited only by a computer’s total memory size.
In this example, there may be a number of specific inclusions/exclusions (e.g., include the central laboratory and a subset of satellite laboratories, but exclude certain other satellite labs), and these can typically be handled in a few lines of R code. Tests may also be counted in specific ways (e.g., use white blood cell count as a surrogate for the total number of complete blood counts, and ignore other complete blood count elements, or even more complicated permutations). Such calculations in Excel could require manual processing prone to errors.
In contrast, R not only efficiently processes complex rules, but also does so in a reproducible way. If an individual makes a copy/paste error in Excel, it may never be detected; however, R code can be reviewed at a later time for correctness, and it can be reapplied to a new dataset in the same format without starting from scratch. This makes R ideal for recurrent tasks such as calculating turnaround times, assessing quality control compliance, tracking population statistics, and other operationally relevant data. Once data have been analyzed, R can be used to communicate the results in various formats.
In addition to operational work, R supports clinical laboratories’ needs for more advanced analytics and statistical modeling. There is growing interest in applying artificial intelligence/machine learning approaches to laboratory data in order to predict disease. R packages provide access to every major approach in this area, from straightforward logistic regression to random forests and even deep learning.
We have used R, for example, to analyze hematology analyzer results and build a random forest model that flags samples from patients with myelodysplastic syndrome (3). This required no proprietary software—only the freely available data processing tools from R to load and process data, create training and test datasets, build a random forest model, and plot receiver operating characteristic curves showing the performance of this model on independent datasets. Given the importance of predictive analytics for the future of laboratory medicine, R provides an ideal tool for clinical laboratorians to learn about or experiment with these new analytic techniques.
Resources for New R Programmers
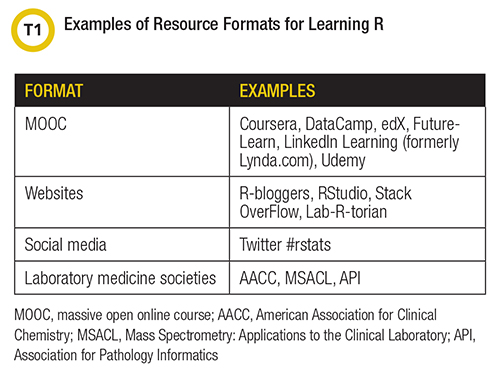
The aforementioned user and contributor base has embraced the open source movement. This user community generously creates and shares resources for learning R in a variety of formats (Table 1). Though the available content is largely not specific to laboratory medicine, learners can quickly and easily find educational materials—many free—for most any application of R through an Internet search or exploration of a book.
Translating general R principles for data manipulation, analysis, and visualization to laboratory-related problems is usually straightforward. Though no prior programming experience is needed to learn R, those new to programming might find it challenging at first. That said, R is one of the fastest growing programming languages and is experiencing a surge of interest within pathology and laboratory medicine.
Learning R requires working with data and writing and executing code. The first steps in learning R involve gaining access to R and RStudio. There are several ways to accomplish this, including downloading and installing R and RStudio or initiating a free RStudio Cloud account (rstudio.cloud). R includes many built-in datasets that are commonly used for demonstrations of package functionality and in tutorials.
Self-paced education is available through several massive open online course formats and from websites focused on R education, examples of which are listed in Table 1. These resources encompass, for example, comprehensive curricula that teach the basics for using R to wrangle, analyze, and visualize data; modules with targeted instruction for performing a specific analysis in R (e.g., build and validate time series forecast models); and other, more focused tutorials on how to use a particular R package or function (e.g., convert datetime formats).
Help with R is not hard to find. For example, the R-bloggers website (r-bloggers.com) lists tutorials and news related to R. A popular source for troubleshooting and for finding example code is Stack Overflow (https://stackoverflow.com/questions/tagged/r), a question and answer site that is a rich resource for R-related information. Clinical laboratorians also can explore a number of books for learning R (Table 2). R for Data Science by Hadley Wickham comprises the foundation of many introductory level short courses and online resources. It is considered a contemporary must-read for those beginning to learn R.
Table 2 - Suggested books for learning R
Links accessed Feb 10, 2020.
Content geared specifically for laboratory medicine professionals is also available with more and more being developed over time. In recent years, AACC and other professional societies have offered short courses designed for learners with varying levels of R experience, and several are planned for the 2020 AACC Annual Scientific Meeting.
Content in these sessions often covers method validation, instrument interfacing, and test utilization reporting. More advanced topics on predictive modeling using laboratory results and database integration have also been presented.
Data Analytics Is in Your Future
We believe that clinical laboratories will require increasing use of data analytics to optimize operations, manage utilization, and provide improved interpretation of complex laboratory data in the context of patients’ medical records. For laboratorians to embrace and thrive in this future, we will need improved tools to process the rapidly changing streams of data that we produce. R provides an excellent format for learning about and, ultimately, implementing the types of computational tools required in a new era of laboratory medicine. Importantly, the skills and computational thinking that a laboratorian acquires by using R also readily translate to other programming languages and informatic approaches. R provides an ideal tool for clinical laboratorians to embrace our data-oriented future.
Shannon Haymond, PhD, DABCC, FADLM, is vice chair for computational pathology at Ann and Robert H. Lurie Children’s Hospital of Chicago and associate professor of pathology at Northwestern University Feinberg School of Medicine. +Email: [email protected]
Stephen Master, MD, PhD, FADLM, is division chief for laboratory medicine at Children’s Hospital of Philadelphia (CHOP) and associate professor of pathology at the Perelman School of Medicine, University of Pennsylvania. He also serves as director of the Michael Palmieri Laboratory for Metabolic and Advanced Diagnostics at CHOP and holds a joint appointment in the division of pathology informatics. +Email: [email protected]
References
- Holmes DT, Buhr KA. Widespread Incorrect Implementation of the Hoffmann Method, the Correct Approach, and Modern Alternatives. Am J Clin Pathol 2019; 151:328-36.
- Wickham H, Averick M, Bryan J, et al. Welcome to the tidyverse. J Open Source Softw 2019; 4: 1686.
- Raess PW, van de Geijn GJ, Njo TL, et al. Am J Hematol 2014; 89:369-74.