[Download pdf] 
Authors
Allison Chambliss
Department of Pathology and Laboratory Medicine
University of California, Los Angeles
Los Angeles, CA
Khushbu Patel
Department of Pathology and Laboratory Medicine
Children's Hospital of Philadelphia
Philadelphia, PA
Jessica Colón-Franco
Department of Laboratory Medicine
Cleveland Clinic
Cleveland, OH
Joshua Hayden
Department of Laboratories
Norton Healthcare
Louisville, KY
Sophie E. Katz
Division of Infectious Diseases
Department of Pediatrics
Vanderbilt University Medical Center
Nashville, TN
Emi Minejima
Department of Clinical Pharmacy
University of Southern California
School of Pharmacy
Los Angeles, CA
Alison Woodworth
Global Laboratory Services
CTI Clinical Trails and Consulting
Cincinnati, OH
Introduction
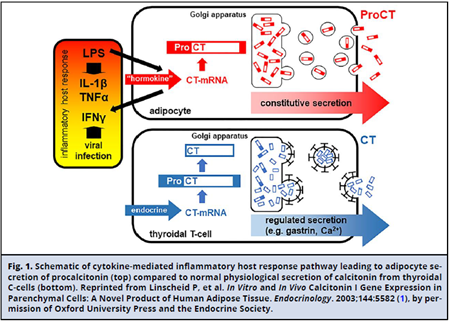
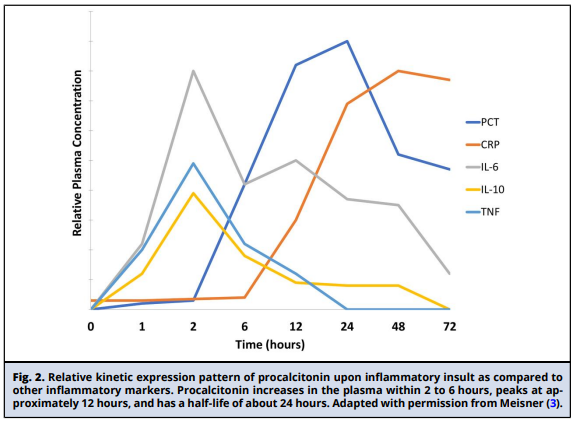
Procalcitonin (PCT), the precursor of the hormone calcitonin, is a 116 amino acid protein encoded by the CALC-1 gene. The product of this gene is prePCT, which undergoes sequential proteolytic cleavage to produce PCT and calcitonin (Fig. 1). Under normal physiologic conditions, transcription of the CALC-1 gene occurs in neuroendocrine cells, primarily in the thyroid C-cells, and circulating concentrations of PCT are undetectable. In response to stimuli such as bacterial infection and systemic inflammation, production of PCT is activated in numerous nonthyroidal cells (i.e., adipocytes and fibroblasts) unable to process PCT into calcitonin, leading to its accumulation (2). Production of PCT in response to bacterial infection is cytokine mediated. Interleukin-1 p, tumor necrosis factor-a, and interleukin-6 activate PCT production. Interferon-y, secreted during viral infection, counter-regulates its expression (Fig. 1). Expression of PCT increases within hours of the inflammatory insult, peaks at approximately 12 hours, and has a half-life of about 24 hours (Fig. 2) (4). The extent of PCT increase correlates with the severity of disease, while decreasing concentrations indicate disease resolution. As a small protein (14.5 kDa), PCT is believed to be eliminated primarily by the kidneys. The aforementioned attributes led to PCT's emergence as a biomarker of infection specifically able to distinguish bacterial from viral infections. PCT has been regarded as potentially useful across some clinical settings to aid in the diagnosis of sepsis; predict disease severity and outcomes, including mortality; and guide antibiotic therapy, as demonstrated by a number of studies and clinical trials that are referenced in this document. However, for several clinical settings and patient populations, the utility of PCT remains undefined.
Although the need for biomarkers to aid in managing septic patients is well accepted, PCT adoption as routine standard of care has not been straightforward. PCT use in the United States was not widespread until recently, when additional assays and clinical indications were cleared by the Food and Drug Administration (FDA). However, PCT was widely used across European countries, where most of the original published clinical trials took place. At the time of manuscript preparation, the FDA had cleared 42 PCT assays. Approved indications were initially limited to assessment for risk of disease progression to severe sepsis and/or septic shock among critically ill patients. More recently, some of the PCT assay manufacturers have added the cumulative 28-day risk of all-cause mortality and antimicrobial stewardship in patients with respiratory illnesses and/or sepsis as intended uses as well. Factors inhibiting widespread use of PCT may include lack of specificity for sepsis/infection, overall lack of consensus on the utility of PCT across various clinical settings and patient populations, and variability in its interpretation (i.e., cutoffs, when to measure).
This document aims to provide evidence-based guidance in how to best use PCT across various clinical settings and patient populations to improve patient outcomes. The document is intended for clinical and laboratory stakeholders, particularly those caring for adult and pediatric patients with suspected sepsis and respiratory infections (e.g., physicians/assistants, nurses, pharmacists, laboratorians). A detailed review of the English literature was conducted for PCT studies in adult (>100 patients), pediatric, and neonatal populations in order to answer the following questions addressing key aspects for PCT-guided management of patients with suspected sepsis, respiratory, or defined site-specific infections. In preparing this document, we focused on applying the FDA-cleared indications for PCT in both adults and pediatrics.
- Can PCT results be utilized to inform treatment decisions in both initiation and cessation of antimicrobial therapy in adult patients with sepsis or respiratory infections?
- Is PCT an accurate predictor of outcomes (mortality, respiratory failure, shock) in adult populations?
- Can PCT results be utilized to inform treatment decisions in both initiation and cessation of antimicrobial therapy in neonatal and pediatric patients with sepsis or respiratory infections?
- Is PCT an accurate predictor of outcomes (e.g., mortality, respiratory failure, shock) in pediatric populations?
- When and how often should PCT be measured? Which cutoff(s) should be used?
- How should PCT be incorporated into antimicrobial stewardship efforts?
- What preanalytical factors affect PCT results and/ or interpretation?
- What FDA-approved methods are available to measure PCT and how do they compare?
- Are clinical decision points (cutoffs) comparable across PCT assays?
- What are possible confounding factors for the interpretation of PCT results?
CAN PCT RESULTS BE UTILIZED TO INFORM TREATMENT DECISIONS IN BOTH INITIATION AND CESSATION OF ANTIMICROBIAL THERAPY IN ADULT PATIENTS WITH SEPSIS OR RESPIRATORY INFECTIONS?
Multiple meta-analyses have evaluated the utility of PCT to guide decisions on antibiotic initiation for sepsis and respiratory tract infections (RTIs) (5-9). Data about the use of PCT to safely reduce antibiotic treatment for patients with sepsis and lower respiratory tract infection (LRTI) is encouraging. In patients with sepsis admitted to an intensive care unit (ICU), there is relatively strong evidence to support the use of PCT to reduce antibiotic duration (10-16). The data regarding use of PCT in patients with LRTI is less straightforward, with more recent studies demonstrating little benefit with the addition of PCT (17-20). This section focuses on studies that included evaluation of outcomes based on using PCT to inform decisions regarding antibiotic initiation and cessation.
Antibiotic Initiation in the Critically Ill
There were a limited number of studies that addressed the impact of PCT utilization on rates of antibiotic initiation in critically ill patients in the ICU. Layios et al. implemented a PCT protocol to guide antibiotic initiation and specifically reported the rate of initiation of antibiotics as an outcome (21). This was a randomized controlled trial (RCT) of 5 ICUs and 509 total patients and evaluated the rate of initiation of antibiotics, which was not significantly decreased by the availability of PCT compared to standard of care (PCT 62.6% vs control 57.7%, P = 0.11). Possible explanations for the lack of benefit included a low rate (25%) of PCT results that were <0.25 ng/mL, critical illness of patients that prompted clinicians to overrule the PCT treatment algorithm, and a low rate (57%) of initiation of antibiotics in the control arm compared to prior studies. Jensen et al. also implemented an antibiotic initiation PCT protocol in a multicenter RCT study of critically ill patients in the ICU in Denmark (n = 1200) (22). In the PCT arm, an "alert procalcitonin" notification was provided when the initial PCT was >1 ng/mL to initiate antibiotics or when subsequent PCT levels were not decreasing by 10% from the previous day to intensify the antibiotic course. In this study, they found the PCT group had a longer antibiotic course by a median of 2 days [PCT median 6 days (interquartile range [IQR] 3-11)] vs standard of care of 4 days (IQR 310). Antibiotic initiation rates were only reported for guideline concordant cases with PCT >1 ng/ mL, which was 82.1% in the PCT group and 82.4% in the standard of care group. As 28-day mortality rates were comparable between the 2 groups (PCT vs standard of care: hazard ratio [HR] 0.98; 95% CI, 0.83-1.16), the authors concluded that PCT was not effective to guide initiation or escalation of antibiotic therapy over standard of care practices and led to increased use of broad-spectrum antibiotics.
Three studies that had a mixed initiation and cessation PCT protocol reported the rate of antibiotic initiation compared to a control group. In the PRORATA trial, a large randomized clinical trial (n = 621) by Bouadma et al. that included critical care patients in France, 28/307 (9%) in the PCT group did not receive antibiotics at study inclusion in accordance with the prespecified algorithm (<0.5 ng/mL) (14). Eight of the PCT group then proceeded to be given antibiotics within 5 days, and 7/8 survived. In comparison, 15/314 (5%) of the control group did not receive antibiotics at inclusion, and 8/15 proceeded to be given antibiotics within 5 days; 1/5 survived. Otherwise, the rate of initiation of antibiotics in patients who had PCT levels that fell outside of the prespecified range included 65/307 (21%) patients who were initiated on antibiotics when PCT was <0.5 ng/mL and 4/307 (1%) who were not given antibiotics although the PCT was >0.5 ng/mL. Additional details on antibiotic exposure outcomes related specifically to antibiotic initiation were not teased out from the total use combining the initiation and cessation protocol. Overall algorithm adherence was 53% in the PCT group. In a second RCT with mixed initiation and cessation PCT protocol of ICU patients with severe acute exacerbation of chronic obstructive pulmonary disease (AECOPD) (n = 302), although there was no significant difference in the proportion of those who received antibiotics at baseline (PCT group 58% vs control 62%, P = ns), by day 1 there were significantly fewer patients in the PCT arm who remained on antibiotics (P < 0.001) (18). In a subgroup analysis, those who were not on antibiotic therapy initially and used the PCT to guide antibiotic initiation had a significantly higher 3-month mortality compared with the control group (PCT 19/61, 31% vs control 7/58, 12%, P = 0.015). In summary, the data on the utility of PCT to guide initiation of antibiotics in critically ill patients is currently limited and does not show benefit in decreasing antibiotic prescriptions.
Antibiotic Cessation in the Critically Ill
We reviewed 5 RCTs comparing PCT-guided antibiotic duration with standard antibiotic duration (Supplemental Table 1) with sample sizes that ranged from 110 to 1546 patients (10-16, 23). Overall, 3757 patients were enrolled in these trials. All studies demonstrated a reduction in antibiotic use with PCT guidance compared to standard antibiotic duration, with reductions in days on antibiotics of about 2 days. Major limitations to study interpretation included the variation in timing of PCT measurements among studies and variation in the PCT concentration thresholds utilized to drive discontinuation of antibiotic therapy among studies. One study by Hochreiter et al. did not report frequency of PCT measurement or turnaround time for PCT result notification (15). The other 7 studies each obtained PCT measurements on enrollment and then at variable time intervals ranging from daily to every 5 to 7 days until ICU or hospital discharge (10-14, 16, 23). Absolute cut points for antibiotic discontinuation were 0.25 ng/mL (16), 0.5 ng/mL (11-14), or 1 ng/ mL (10, 15, 23). Most studies also allowed for antibiotic discontinuation based on a relative decrease in PCT concentrations over time. The majority of studies used an 80% to 90% decrease from peak value to direct antibiotic cessation, although one study used a 50% drop compared to the previous value (10), and another used a 25% decrease from peak concentration (15). Only 2 studies reported turnaround time for PCT result notifications from lab personnel to study providers (14, 16). In both studies, results were available within 2 to 3 hours of specimen collection (15). The other 4 studies each obtained PCT measurements on enrollment and then at variable time intervals ranging from daily to every 3 days until ICU or hospital discharge (10-14, 16, 23). Absolute cut points for antibiotic discontinuation were 0.5 ng/mL (11-14) or 1 ng/mL (10, 15, 23). Most studies also allowed for antibiotic discontinuation based on a relative decrease in PCT concentration over time. Only one study reported turnaround time for PCT result notifications from lab personnel to study providers, and results were available within 2 to 3 hours of specimen collection (14).
Compliance rates with PCT-driven antibiotic cessation algorithms also varied greatly among studies, ranging from 28.7% to 97%. Most often, providers chose to continue antibiotics despite a low PCT level. Noncompliance with algorithm guidance may have skewed study results. However, as noted earlier, all studies demonstrated significant decrease in antibiotic use when using PCT guidance, and noncompliance with algorithms would have more often led to similar results in the PCT and standard of care groups.
In a 2018 meta-analysis, Meier et al. describe 523 patients with positive blood cultures from 13 clinical trials that randomly assigned patients to either PCT-guided treatment or a standard of care group (24). The mean duration of antibiotic therapy was 2.86 days shorter in the PCT-guided group compared to the control group (95% CI, -4.88 to -0.84 days, P = -0.006), and mortality was again similar between groups (16.6% PCT vs 20% control, P = 0.263). This study highlights that PCT guidance for antibiotic duration may be a safe and effective way to decrease antibiotic use among patients with bacteremia.
In summary, all studies evaluated demonstrated a reduction in antibiotic use with PCT guidance compared to standard antibiotic duration. Limitations found across studies included differences in compliance rates for the antibiotic cessation algorithms that may have limited the benefit in certain populations.
Antibiotic Cessation in Respiratory Tract Infections
There were 11 RCTs comparing PCT-guided therapy with standard antibiotic therapy for treatment of patients with LRTI, including CAP, COPD, non-pneumonia LRTI, and VAP (Supplemental Table 2) (17, 19, 20, 30-34). Sample sizes ranged from 45 to 1656 patients; only one study had fewer than 100 patients. There were 10 RCTs comparing PCT-guided therapy with standard antibiotic therapy for treatment of patients with LRTI, including CAP, COPD, nonpneumonia LRTI, and VAP (Supplemental Table 2) (17, 20, 30-34). Sample sizes ranged from 101 to 1656 patients. Overall, 3905 patients were enrolled in these trials. There were an additional 3 retrospective studies evaluating PCT for antibiotic discontinuation (35, 36) and one prospective cohort study (37). The impact of PCT measurement on antibiotic use varied among studies, with 6/11 demonstrating reduction in antibiotic use with PCT guidance. None of the 4 RCTs published since 2016 have demonstrated benefit in using PCT to decrease antibiotic use in patients with RTIs (17-20). Possible reasons for the lack of benefit seen may be due to a different population being investigated (severe AECOPD vs mild to moderate AECOPD) (18), lower algorithm adherence rates (19) compared to prior studies (32), or more contemporary studies including antimicrobial stewardship in the standard of care arm that reduced the antibiotic duration.
Timing of PCT measurements and frequency with which PCT was measured varied among studies. The first measurement was obtained at or within 24 hours of enrollment in all studies. The timing of the next measurement varied in all studies, ranging from 12 hours to 5 days after the first. No studies required PCT measurements after day 10, and most stopped testing on day 7. Of the studies that mentioned timing from sample collection to provider notification of results, most were available within 1 hour. Cut points used to discontinue antibiotics also varied across studies. Ten of the 11 studies used an absolute value of 0.25 ng/mL to recommend antibiotic discontinuation (17-20, 31, 32, 38-40). The remaining study used an absolute value of 0.5 ng/mL (41). Five of the studies utilizing LRTI patients also allowed for antibiotic discontinuation based on a relative decrease in PCT concentration of >80% (20, 32, 41, 42) or > 90% (18) when compared to the peak PCT concentration or the concentration at randomization. Compared to studies using PCT for antibiotic discontinuation in sepsis, compliance rates with PCT algorithm guidance were higher in pneumonia studies, ranging from 61% to 85%. Compliance rates were not reported in 2 of the studies (18, 20). A more detailed discussion of PCT collection timing and frequency is included in a later section of this document.
All included RCTs published prior to 2011 demonstrated reduction in antibiotic use with PCT guidance and did not demonstrate increased risk of mortality (if included as an outcome) (32, 39-41). However, RCTs published since 2016 have not demonstrated reduced antibiotic use with PCT guidance compared to control (17-19, 38, 42). Proposed reasons for this decrease in effect size include shorter baseline treatment durations for most patients with LRTI and low algorithm compliance rates. Two recently published retrospective studies with more than 300 patients in each study demonstrated significantly shorter antibiotic duration in patients with LRTI in whom a PCT-guided antibiotic cessation algorithm was followed (35, 36). Schuetz et al. published in 2017 a Cochrane review of 26 randomized clinical trials on RTIs with a patient level meta-analysis of 6708 participants (7). All-cause 30-day mortality was significantly lower with the PCT-guided therapy (adjusted OR 0.83; 95% CI, 0.70-0.99, P = 0.037). Reduction in total antibiotic exposure (mean 8.1 days compared to 5.7 days, regression coefficient -2.43 days [95% CI, -2.71 to -2.15, P < 0.001]) was observed, although the rate of initiation of antibiotics was not reported.
In summary, conclusions regarding the impact of PCT measurement on antibiotic cessation in LRTI are mixed among studies. Earlier studies and meta-analysis show overall decrease in antibiotic use with PCT, while the more recent RCTs have shown no difference relative to standard of care without PCT.
Other Biomarkers Evaluated to Guide Antibiotic Initiation or Cessation in Respiratory Tract Infections
There are limited studies available that evaluated the performance of other biomarkers (e.g., CRP) compared to PCT on antibiotic prescribing patterns for LRTI. However, CRP has been evaluated in RTIs for its utility to guide antibiotic prescribing decisions, most notably in the primary care settings, where it has demonstrated decreased antibiotic prescriptions (43-45). In an outpatient setting, point-of-care CRP testing led to significantly fewer antibiotic prescriptions for acute LRTI and rhinosinusitis as compared to standard of care (43.4% vs 56.6%, relative risk 0.77; 95% CI, 0.56-0.98) in the United Kingdom (46).
Butler et al. evaluated CRP to guide antibiotic prescription decisions in AECOPD in a multicenter RCT (n = 653) (47). A CRP point-of-care test was performed at presentation in the intervention arm, with guidance that for CRP <20 mg/L, antibiotics were unlikely to be beneficial, for CRP 20-40 mg/L, antibiotics may be beneficial in the presence of purulent sputum, and for CRP >40 mg/L, antibiotics were likely to be beneficial. The availability of rapid CRP results significantly decreased the number of patients who received an antibiotic prescription (47.7% vs 69.7%, adjusted OR 0.31; 95% CI, 0.21-0.45). Similarly, Prins et al. found that using CRP significantly decreased antibiotic prescriptions compared to using Global Initiative for Chronic Obstructive Lung Disease guidelines (based on symptoms of purulent sputum) in their RCT of 220 adults in the Netherlands (CRP 31.7% vs Global Initiative for Chronic Obstructive Lung Disease 46.2%, P = 0.028) (48). However, neither study directly compared CRP vs PCT performance.
Additional data is needed to compare CRP vs PCT for antibiotic initiation or cessation in other LRTI, such as pneumonia, and in the inpatient setting. As CRP is typically a less expensive inflammatory marker test than PCT, cost-effectiveness studies comparing the 2 markers would be helpful to guide laboratories considering implementation of PCT.
Key summary points
- In patients admitted to the ICU, PCT should be used to reduce antibiotic duration. Data does not support using PCT to guide initiation of antibiotics in these patients.
- In patients with LRTI, PCT may be used to safely reduce antibiotic exposure and duration, but there is less evidence to support this recommendation, particularly in VAP.
- Studies to date have shown significant variation in PCT testing algorithms in terms of cut points and timing of PCT measurements.
- Other inflammatory markers, such as CRP, have shown benefit in decreasing antibiotic initiation in primary care settings and AECOPD, although conclusions are mixed. Direct comparison of CRP and PCT is still lacking in LRTI. As CRP is typically less expensive and may be a more widely available biomarker than PCT, additional cost-effectiveness studies are also needed.
IS PCT AN ACCURATE PREDICTOR OF OUTCOMES (E.G., MORTALITY, RESPIRATORY FAILURE, SHOCK) IN ADULT POPULATIONS?
PCT is upregulated in response to proinflammatory signals, and its concentrations increase with increased disease severity (3). Concentration decreases over time are associated with disease recovery, while consistently elevated or increasing PCT concentrations are a signal of persistent or more severe illnesses. Thus, researchers have studied the ability of PCT to predict outcomes in a variety of disease states. Among the most commonly studied outcomes are mortality and disease progression.
The literature investigating the potential utility of PCT in predicting outcomes is significant. Mortality is an important outcome among critically ill patients given that approximately 270 000 septic patients die each year in the United States alone (49). With recent updates to FDA-approved intended uses of these assays, we chose to look more closely at publications since 2010 with at least 100 patients enrolled that investigated the correlation between PCT concentrations and mortality. Fourteen of these looked at 28/30-day all-cause mortality (Supplemental Table 3). Among the 28-day mortality studies, the patient populations ranged from ED, ICU, and/or hospital in-patients with sepsis, RTIs, and other infections. Two of these studies were separate large meta-analyses of >3000 patients each looking at PCT in septic and RTI patients (50, 51). One of these studies was an RCT; however, the investigation of 28-day mortality was a secondary analysis (52).
Outcomes from Single PCT Measurements
All studies demonstrated an association between initial PCT concentrations measured at presentation and/or evolution over time (discussed later) and 28/30-day mortality (Supplemental Table 3). Most of the studies show that, independent of patient population, PCT is significantly higher in patients that will go on to die within 28/30 days compared to those who survived (10, 53-57). The prognostic utility of initial PCT measurements to predict 28-day mortality is often assessed by generating receiver operator characteristic curves and calculating the Area under the Curve (AUC). These AUCs range from 0.56 to 0.82 among studies where the time of initial PCT measurement was clearly delineated (10, 50-53, 56, 58-60). In their meta-analysis, Liu et al. demonstrated in a diverse patient population that a single PCT measurement had a moderate ability to predict mortality. The area under the summary receiver operating characteristic curve was 0.73 (0.69-0.77) (n = 13 studies) (51). Follow-up PCT measurements in patients with signs of infection at 72 hours after the initial test were also significantly higher in patients who died (60). However, in patients with autoimmune disease and sepsis, PCT concentrations at 72 hours were not significantly different in survivors compared to nonsurvivors (61). This group also looked at the correlation between PCT peak concentration and mortality and found variable results depending on patient population (61). Similarly, in their large multicenter prospective observational study with more than 1700 septic shock patients, Ryoo et al. were unable to demonstrate that elevated PCT, measured at presentation to the ED, was significantly predictive of 28-day mortality (62). The authors attribute this apparent discrepancy, compared to similar studies, to PCT being measured too soon after presentation and their patient population (ED vs ICU). In summary, a single PCT measurement at presentation is associated with higher mortality rates; however, patient population, time of PCT measurement, and other factors confound study results and limit the utility of a single PCT measurement to predict mortality.
Outcomes from Sequential PCT Measurements and PCT Clearance
PCT has a distinct expression pattern following an infectious insult (Fig. 2). Further, PCT expression persists throughout infection and decreases as the infection is cleared (3). Therefore, many have advocated monitoring PCT kinetics/concentration change over time as a prognostic marker in patients with infections (3). Sometimes referred to as the PCT delta, this change in PCT over time has been associated with clinical outcomes. Specifically, a PCT decrease over time, referred to as PCT clearance, suggests that a patient is responding to antimicrobial or other therapy. By contrast, persistent PCT expression over time, also called PCT nonclearance, is associated with poor outcomes in critically ill and septic patients (51).
Among recent studies, 5 demonstrated that a lack of PCT clearance over time was a good predictor of 28/30-day mortality (51, 52, 61, 63, 64). Of these, one was a large meta-analysis where a subset analysis of 9 studies with 868 septic patients demonstrated that lack of PCT clearance, defined by a decrease in PCT of at least 25% (range 25%-70%) in 48 hours to 7 days, could predict mortality (28 day and hospital) with a summary AUC of 0.79 (0.75-0.83), and pooled relative risk of mortality was 3.05 (2.35-3.95) (51). The authors concluded that while the prognostic utility of the initial PCT value is limited, PCT nonclearance better predicts mortality and its performance is superior to following clearance of other biomarkers like lactate. Subsequently, one essential study of 13 US medical centers including 858 patients admitted to the ICU with severe sepsis or septic shock from the ED or other hospital locations demonstrated that a lack of PCT decrease over time was a good predictor of 28/30-day mortality. The study found that although PCT was higher in nonsurvivors (mean 5.2 [95% CI, 3.9-7.0] vs 3.4 ng/mL [95% CI, 2.8-4.0, P< 0.02]), this baseline value was a poor predictor of 28-day mortality (AUC 0.56; 95% CI, 0.51-0.60) (63). In patients in which PCT did not decrease by >80% between baseline and day 4, 28-day mortality was 20.0% (hazard ratio 1.97, multivariate adjustment, P = 0.009), twice as high as the group with this decline (P = 0.001). At this cutoff, sensitivity was 77% (95% CI, 65-81) and specificity was 39% (95% CI, 35-43) with similar performance regardless of whether the patients were in the ICU at day 4. Notably, ICU residency by day 4 was a strong independent predictor of mortality (hazard ratio 2.69, multivariate adjustment, P < 0.0001), with much higher mortality than among those discharged to the hospital floors (26 vs 9%). In a secondary analysis comparing PCT at baseline and day 1, PCT increased by 30% (95% CI, 15-47) and by 0% (95% CI, -7 to 6) for those who died and survived, respectively (P < 0.0001), and mortality increased 3-fold in patients with an increase in PCT compared to a decrease in PCT (29 vs 12%, P< 0.0001). Mortality was approximately 3 times higher if PCT did not decrease by 80%, regardless of whether the initial PCT concentration was above or below 2 ng/mL. This study demonstrated that both short and longer serial approach/PCT clearance are stronger prognosticators than an initial single PCT measurement. Finally, in their large RCT of 1089 patients with severe sepsis or septic shock, Elke et al. demonstrated that a PCT decrease < 20% from baseline to day 1 was associated with a significantly higher 28-day mortality rate compared to those in whom PCT declined by > 20%. In this same patient population, there was a significantly lower risk of mortality for those in whom PCT declined by > 50% between days 0 and 4 compared to those with a < 50% PCT decline. Although the parameters of the PCT delta calculation are not standardized, the lack of PCT clearance over time does predict 28-day mortality in diverse patient populations.
Outcomes for Patients Presenting to the ED
Some differences are noted in the utility of PCT among different patient populations. In general, there are far fewer studies in ED patients looking at the ability of initial PCT concentrations to predict mortality. The meta-analysis by Liu et al. included only 3 studies in the ED, which limited their ability to evaluate PCT's ability to predict mortality in ED patients (51). An individual patient meta-analysis including 2605 ED patients concluded that PCT measurement at presentation predicted mortality (AUC 0.67, P < 0.001, OR 1.82) and correlated with treatment failure (i.e., death, ICU admission, re-hospitalization, and complications or recurrent or worsening infection within 28 days) (AUC 0.64, P < 0.01, OR 1.85) (50). In reality, this performance is modest for predicting treatment failure and mortality and awaits confirmation by other studies. In their meta-analysis of septic patients (ED and hospitalized), while pooled mean PCT concentrations measured on days 1 and 3 were both significantly different between survivors and non-survivors and able to predict mortality, the correlation was stronger once ED patients were excluded (82). In their multicenter trial, Saeed et al. investigated several biomarkers' abilities to predict 28-day mortality when measured at initial assessment in ED patients with suspected infections. PCT measurement at initial ED evaluation showed moderate ability to predict 28-day mortality (AUC 0.72-0.75), which is similar to other studies in diverse patient populations (53). Of note, the mortality rate in this patient population was low at approximately 7%. In their multicenter, multinational ED cohort study, Sager et al. demonstrated that PCT concentrations, when measured during the ED stay, predicted 30-day mortality (56). In contrast, in a third study looking at ED patients with septic shock (20.7% mortality), Ryoo et al. showed that initial PCT measurement was not an independent predictor of 28-day mortality. The authors suggest that their findings may differ from other studies because all PCT measurements were collected prior to initiation of antimicrobial therapy (62). Unlike Ryoo and colleagues' population, most other studies utilized patients having received prior antibiotics (51, 52, 63). In their large meta-analysis of patients with RTI, initial PCT concentrations predicted mortality at 30 days when measured at ED admission but not at ICU admission, with AUCs of 0.67 and 0.5, respectively (50). In their study, Yu et al. demonstrated that in patients with a suspected infection in the ED or hospital floor, addition of an initial PCT concentration to qSOFA score > 2 significantly improved prediction of 30-day mortality (58).
In general, most studies comparing the prognostic utility of initial PCT concentrations and PCT clearance showed differences in its ability to predict 28/30-day mortality depending on patient location (i.e., ED vs ICU). This is likely due to differences in disease severity and treatments noted in several studies.
Outcomes Differ by Patient Diagnoses, Sepsis Definitions, and Study Populations
Groups have also identified differences in PCT's prognostic utility across patients' diagnoses. In septic patients, discrepancies among studies could be due to the sepsis definition utilized. Studies published prior to 2016 likely utilized either the Sepsis-1 or -2 definition to classify patients, whereas the Sepsis-3 definition may have been used in more recent studies (83). In their meta-analysis, Elke and colleagues demonstrated that mortality rates differed among sepsis populations depending on the definition utilized. However, regardless of the sepsis definition (Sepsis-1 vs Sepsis-3), PCT concentrations measured within 24 hours of a severe sepsis or septic shock diagnosis were a poor predictor of 28-day mortality (AUC was 0.56 for both populations) (52). Interestingly, in their meta-analysis of septic patients, while PCT concentrations measured on days 1 and 3 were both significantly different between survivors and nonsurvivors in the total population, in a subgroup analysis of patients with severe sepsis or septic shock, PCT concentrations were not significantly different in patients who died (82).
Among patients with RTI, initial PCT concentrations correlated with 30-day mortality in patients with COPD and CAP but not in patients with acute bronchitis or VAP (50). Elke et al. demonstrated that PCT, measured at baseline, had marginally improved mortality prediction among patients with pneumological compared to intraabdominal infection (AUC 0.58 vs 0.52). Further, initial PCT concentrations were significantly correlated with 28-day mortality among patients with gram-positive and -negative infections but not among patients with fungal infections (52). Most studies noted differences in the PCT's ability to predict 28/ 30-day mortality across different diagnosis, likely due to differences in disease severity, treatments, and mortality rates in the individual populations.
One other source of confusion regarding the prognostic value of PCT is that significant heterogeneity exists among data sets in individual studies, making it difficult to draw conclusions. In their meta-analysis, Liu et al. demonstrated significant heterogeneity across data sets in individual studies, especially their mortality rates, which ranged from 17% to 66.7% (51). In a large meta-analysis of patients with RTI the mortality rate was only 6%, leading to high negative predictive values for PCT (50). In another large meta-analysis conducted by Arora and colleagues looking at the utility of PCT to predict mortality among septic patients, statistical heterogeneity of the patient populations across studies was high, and mortality rates ranged from 13% to 69% (82). More recently, in their study of patients with suspected infection, Yu et al. reported a mortality rate of 9% and were also able to demonstrate high negative predictive values for prediction of 30-day mortality (58). In contrast, in their study of septic patients, Elke et al. demonstrated that initial PCT concentrations were a poor predictor of 28-day mortality, and their mortality rate was 27% (52). As expected, heterogeneity in patient populations among different studies is significantly impacted by mortality rates and thus the performance characteristics of PCT to predict mortality (51).
Outcomes Other Than 28/30-Day Mortality
While most of the previous discussion has focused on 28/30-day mortality, studies have investigated other outcomes as well. For example, several studies addressed PCT and its correlation with mortality during the patient's hospitalization (51, 52, 60, 63) and/or at other time points, including 7, 14, or 90 days; 1-year post-presentation; or undefined mortality endpoints (46, 48, 51, 58, 60, 61).
There has also been significant interest in utilizing PCT to predict response to therapy. In general, PCT concentrations and/or evolution of PCT concentrations over time are good predictors of successful or failed treatments in a variety of patient populations (50, 84). PCT concentrations at presentation were also correlated with general disease progression, admission to the ICU, and/or length of hospital stay (60). Zaccone et al. showed that PCT measured within 12 hours of admission among 1063 critically ill patients was an accurate predictor of ICU transfer (65). Similarly, in a large population of patients with lower acute respiratory infection (ARI), initial PCT concentrations correlated with treatment failure at 30 days. Further initial PCT concentrations even correlated with treatment failure among patients with certain upper ARIs like the common cold or rhinosinusitis (50). In contrast, in a population of patients with febrile urinary tract infection, PCT concentrations at presentation, day 3, or PCT clearance over time were able to predict treatment failure with AUCs of 0.52, 0.55, and 0.58, respectively (66).
In summary, PCT concentrations increase with disease severity in patients with sepsis and RTIs as well as in other select patient populations. Elevated PCT concentrations measured at ED or hospital admission in patients with sepsis or LRTI are associated with a greater risk for 28- to 30-day mortality. Similarly, a lack of PCT clearance over time is also associated with a great risk of mortality. Similar trends were observed with other mortality outcomes as well as treatment response and/or disease progression. However, significant heterogeneity in study populations across studies, especially related to mortality rates, limits our ability to formally recommend the use of PCT as a predictor of prognosis.
Other Biomarkers Evaluated to Predict Outcomes in Patients with Sepsis and/or Respiratory Tract Infections
Algorithms that use biomarker results to stratify patients by mortality risk and provide actionable information for patient management are a promising tool for patient care. PCT is likely the best-studied biomarker for this purpose in the context of sepsis and/or RTIs; however, its performance varies across studies (Supplemental Table 3). Although PCT is FDA cleared for predicting outcomes and disease progression in patients with sepsis, factors such as optimal cutoffs and recommended frequency of testing vary by clinical context and thus complicate its operationalization (67-71). These variables are further discussed in later sections. Other biomarkers with prognostic roles include standard of care tests such as lactate and CRP, as well as a growing list of candidate biomarkers including interluekin-6, mid-regional proadrenomedullin (MR-proADM), presepsin, and multibiomarker models. Next we summarize the evidence for the biomarkers currently used clinically and provide an outlook on promising early findings for the newer biomarkers.
Lactate is a key biomarker routinely used for outcome prediction in patients with sepsis despite the low quality of evidence (72). Although it can be elevated in other contexts, increases in blood lactate indicate tissue hypoxia, and its measurement is a surrogate marker of hypoperfusion. Patients with elevated lactate concentrations have poor outcomes while sufficient decreased lactate over time (also referred to as lactate clearance) is associated with decreased mortality. In adults patients admitted to the ICU, the likelihood of mortality decreased by 11% for every 10% increase in lactate clearance (73). In children with septic shock, failure to achieve a lactate clearance of >10% increased the risk of mortality (likelihood ratio 2.83; 95% CI, 1.824.41) (74). Surviving Sepsis Campaign guidelines recommend measuring lactate promptly after sepsis is suspected or identified and remeasuring it if elevated >2 mmol/L (72). A lactate value of >4 mmol/L warrants fluid resuscitation and normalization is targeted (72). RCTs evaluating lactate clearance for therapy guidance and outcomes vary in their conclusions. For in-hospital mortality, one RTC found a reduction only when adjusted for risk factors (75), while another did not find an effect (76). Tian et al. reported that 10% and 30% lactate clearance was not associated with a reduction in 7-day mortality rate, but the 28-day mortality was significantly lower in patients with ample lactate clearance (77). A meta-analysis including these studies (547 patients) concluded the use of lactate clearance to guide therapy reduces the risk of mortality (risk ratio of 0.65; 95% CI, 0.49-0.85) (78). It is important to consider that lactate clearance is only appropriate for use in patients with severe sepsis and/or septic shock as it is not elevated in early and/or mild sepsis.
CRP has been heavily studied as a sepsis bio-marker and is frequently utilized to monitor numerous inflammatory disorders. The evidence is controversial regarding its role as an outcomes predictor in patients with sepsis and/or RTIs. Several studies report that, in comparison to PCT, CRP measurements at study enrollment and/or admission are not significantly higher in survivors compared to nonsurvivors (52, 58, 60). In 2 studies comparing prognostic utility of several biomarkers, including PCT and CRP, in patients presenting to the ED, PCT and CRP were significantly associated with 28-day mortality, but neither was considered an independent predictor of mortality (53, 62). In general, CRP lacks significant clinical utility as a prognostic marker.
Other new biomarkers may have promise but have not been adopted into clinical practice. MR-proADM is a product of proADM, generated in a 1:1 ratio with adrenomedulin, a calcitonin peptide family mostly known for its vasodilatory activity. Like PCT, MR-proADM elevations are not specific to infections. Several studies have established a relationship between MR-proADM and outcomes such as disease progression and mortality and its superiority compared to other bio-markers including PCT, CRP, copeptin, and presepsin (67-71). One such study, a prospective multicenter study, reported that MR-proADM outperformed PCT and CRP, and clinical scores such as SOFA/qSOFA and National Early Warning Score for ICU admission and 28-day mortality in ED patients (n = 684) at presentation and 3 days after (60). MR-proADM had the strongest association by univariate analysis with requirement for ICU admission (OR 4.1 [2.3-7.1] vs PCT OR 2.2 [1.5-3.4] vs CRP 2.1 [1.2-3.6]) and 28-day mortality (MR-proADM OR 4.1 [2.6-6.5] vs PCT OR 1.9 [1.32.7] vs CRP OR 1.0 [0.7-1.5]). Adding MR-proADM and PCT increases the correlation with mortality (hazard radio 5.7 [2.8-11.6]), a combination that could be explored further. The study utilizes a noncommercial^ available point-of-care analyzer for PCT and MR-proADM. Although the availability of rapid testing could increase access to these biomarkers for decision-making, more data will be needed to demonstrate the required analytical performance characteristics to support such applications. Studies using a laboratory assay available for MR-proADM (79) demonstrated consistent MR-proADM performance. Mearelli and colleagues showed that MR-proADM improves qSOFA's outcome prediction ability (80). Nine biomarkers were evaluated in total (CRP, lactate, PCT, soluble interleukin 2 receptor alpha, soluble triggering receptor expressed on myeloid cell-1, secretory phospholipase A2 group II, presepsin, MR-proADM, and soluble tumor necrosis factor receptor-1) as a secondary analysis of a prospective study conducted in 5 EDs in Italy. The analysis found the highest AUROC of 0.83 (95% CI 0.80.87) when combining clinical parameters with CRP, lactate, and MR-proADM. The study by Elke and colleagues also reported MR-proADM was the strongest mortality predictor at baseline relative to PCT and CRP in patients with sepsis (AUC 0.73 vs 0.56 for PCT and 0.55 for CRP) and septic shock (AUC 0.72 vs 0.50 for PCT and 0.53 for CRP); MR-proADM remained the strongest predictor at days 1, 4, 7, and 10. In summary, there is some data to suggest a potential role for MR-proADM in outcomes prediction in septic patients, however, currently, MR-proADM assays are not widely available or cleared for this use.
Presepsin, a subtype of soluble cluster-of-differentiation marker protein 14, is released into the blood after lipopolysaccharides in microorganisms bind cluster-of-differentiation marker protein 14 in monocytes and macrophages. Its prognostic role has been extensively described but mainly in observational studies with small sample sizes. Presepsin is significantly higher in nonsurvivors in ED and ICU settings and with a weighted pooled standardized mean difference of 1.09 (95% CI, 0.78-1.41) for 30-day mortality. When compared to PCT, there is no conclusive evidence pointing to the superiority of presepsin for mortality prediction. A meta-analysis of 9 studies and approximately 1500 patients in ED and ICU settings concluded that presepsin is not superior to PCT for mortality prediction (81). The AUC of PCT was 0.81 (95% CI, 0.78-0.84) with a pooled sensitivity of 0.76 (95% CI, 0.55-0.89) and specificity of 0.74 (95% CI, 0.33-0.94), and the AUC of presepsin was 0.77 (95% CI, 0.73-0.81) with pooled sensitivity and specificity of 0.83 (95% CI, 0.72-0.90) and 0.69 (95% CI, 0.63-0.74), respectively. These studies utilized a unified point-of-care assay (PATHFAST, LSI Medience Corp.), yet cutoffs and clearance strategy are not standardized.
As discussed with only a few examples, new biomarkers, alone or in combination, show early promising results for roles in predicting outcome. However, the evidence to support the utility of these biomarkers for outcome prediction strengthened is an active area of research. Of note, these biomarkers have almost exclusively been studied in developed counties and in relatively small sample cohorts. Although some have been published as mentioned previously, future studies on these candidate biomarkers in RCTs, across different medical centers, and with larger sample size will be needed to demonstrate if these promising early results can be validated. Moreover, these studies should focus on establishing evidence-based cutoffs, and interpretative criteria is necessary to draw meaningful conclusions for real-live applications. Until then, PCT is the only assay in the United States cleared by the FDA for 28-day mortality prediction in critically ill patients. Despite the FDA approval, the lack of uniformity in the studies make recommendation of a specific clearance cut-off challenging.
Key summary points
- PCT concentrations increase with disease severity in patients with sepsis and RTIs.
- Elevated PCT concentrations measured at ED presentation or hospital admission in patients with sepsis or LRTI are associated with a greater risk of 28-to 30-day mortality.
- In patients with sepsis and/or RTI, the lack of PCT clearance overtime is associated with a greater risk of 28-to 30-day mortality.
- The heterogeneity of patient populations in the studies makes is difficult to form uniform recommendations for the use of PCT as an outcome predictor.
CAN PCT RESULTS BE UTILIZED TO INFORM TREATMENT DECISIONS IN BOTH INITIATION AND CESSATION OF ANTIMICROBIAL THERAPY IN NEONATAL AND PEDIATRIC PATIENTS WITH SEPSIS OR RESPIRATORY INFECTIONS?
There are numerous studies evaluating the role of PCT in critically children in the pediatric ICU (PICU). Many of these studies have investigated the use of PCT to help differentiate serious bacterial infections and distinguish bacterial from viral meningitis (85-92). Since the use of PCT in this manner informs decisions on treatment and initiation of antibiotics, there has been much interest in using PCT to identify or rule out sepsis and serious bacterial infections. Unlike the adult studies, the pediatric studies did not directly evaluate the rate of antibiotic initiation and instead focused on evaluating the sensitivity, specificity, and negative predictive value of PCT in detecting bacterial infections.
PCT for Detecting Bacterial Infections and Initiating Antibiotics in Pediatric and Neonatal Patients
A meta-analysis of 12 studies involving more than 7000 children (<18 years) reported a sensitivity and specificity of 55% and 85%, respectively, for detecting serious bacterial infections (86). For invasive bacterial infections, sensitivity and specificity was 82% and 86%, respectively, using a PCT cutoff of 0.5 ng/ mL. In this analysis, serious bacterial infections included a broad spectrum of infections ranging from bacterial meningitis to urinary tract infections as well as a subgroup of severe invasive bacterial infections including bacterial meningitis, sepsis, and bacteremia. The negative predictive value of PCT was approximately 99% for invasive bacterial infections and ranged from 79.5% to 96.7% for serious bacterial infections.
A meta-analysis of 28 studies that included more than 2600 neonates with suspected sepsis PCT showed a sensitivity of 85% for detecting sepsis, and, when combined with CRP, the sensitivity improved to 91% (87). In a prospective trial of 80 children, PCT was better able to detect severe infections among PICU patients when compared to CRP or white blood cell count (88). Another prospective study of 64 PICU patients showed that PCT outperforms CRP alone in detecting bacterial infections; however, PCT was insufficiently sensitive with an AUC of 0.71 (89). A study of 85 PICU patients with suspected sepsis demonstrated a negative predictive value of 90% when a combination of CRP (<4 mg/dL) and PCT (<1.75 ng/mL) was used to identify critically ill children with a low risk of bacterial infection (90). A retrospective study of more than 600 PICU patients reported a negative likelihood ratio of 0.3 for PCT in ruling out infection (91). There is an increasing amount of evidence that suggests PCT in combination with other biomarkers may be useful in ruling out infection or identifying infants with low risk for serious infections. Kuppermann and colleagues developed a clinical prediction rule (Pediatric Emergency Care Applied Research Network) for identifying <60 day-old infants across 26 EDs that are at low risk for serious bacterial infections to avoid unnecessary lumbar punctures, antibiotic exposure, and hospitalizations. This algorithm incorporated urinalysis, absolute neutrophil count, and PCT, and demonstrated a sensitivity of 97.7% and specificity of 60.0%, with a negative predictive value of 99.6% (92). However, further validation of such multibiomarker algorithms is necessary. An external validation of the Pediatric Emergency Care Applied Research Network rule yielded a sensitivity and specificity of 89.8% and 55.5% for serious bacterial infections, with an AUC of 0.726 when tested in a cohort of 1247 infants presenting to a pediatric ED in Spain (93). The authors caution the use of this prediction rule in young infants with a short history of fever.
Similar observations regarding the ability of PCT to rule out bacterial infections have been made in children <18 years old with LRTI. Using a PCT cutoff of <0.25 ng/mL, a 96% negative predictive value, 85% sensitivity, and 45% specificity was observed for ruling out typical bacterial CAP in a study of 532 hospitalized children with radiographically confirmed CAP (94). Another group had evaluated the utility of PCT in guiding antibiotic treatment in 319 children with pneumonia. A PCT-guided algorithm using a threshold <0.25 ng/mL for withholding antibiotics in the study group (n = 155) resulted in 85.8% children receiving fewer antibiotic prescriptions and a shorter exposure time (3.9% vs 25.2%) compared to the control group without a significant difference in recurrence of respiratory symptoms or new antibiotic prescriptions in the following month (95). However, another study of children (1 month-18 years old) presenting with LRTI found that using PCT-guided algorithms did not alter antibiotic prescription rates but did reduce duration of antibiotic exposure by approximately 3 days. In this study, a PCT >0.5 ng/mL was used to initiate antibiotics and a PCT 0.25 to 5 ng/mL was left to clinical discretion (96).
Collectively these studies suggest that PCT has insufficient sensitivity in detecting sepsis, serious bacterial infections, or LRTI and should not be used as a stand-alone marker to make decisions on initiation of antibiotic therapy. Measuring PCT alone may miss patients with localized but serious infections (91). It is important to note that PCT normal ranges can vary in healthy neonates within the first days of life (peaking at day 1 of life and decreasing to normal by day 2 and 3) (Table 1). Additionally, PCT is not well studied in immunocompromised critically ill children, and it is unknown whether these findings can be extrapolated to this population.
Antibiotic Cessation in Neonatal and Pediatric Populations
While there is no strong evidence to support using PCT concentrations to guide antibiotic initiation in pediatric and neonatal populations, there is evidence that suggests PCT is useful to safely discontinue antibiotics in this population. Neonatal and pediatric PCT trials are summarized in Supplemental Table 4. The largest multicenter RCT in neonates that assessed the impact of PCT-guided decision-making on duration of antibiotic therapy was the NeoPIns trial (97), which enrolled 1710 neonates of >34 weeks gestational age suspected of early-onset sepsis in the first 72 hours of life. Eight hundred sixty-six neonates were assigned to the experimental arm and 844 to the control arm. In the experimental arm, PCT was measured at 12, 24, 36 to 72, and every 24 to 48 hours thereafter until discontinuation of antibiotics. If 2 consecutive PCT values fell within the normal range for the age, antibiotics were discontinued. PCT-guided decision-making led to a 10-hour reduction in antibiotics exposure. However, the impact on reinfection and death during the first month of life could not be entirely assessed due to low occurrence rates of these adverse events. The cutoffs for PCT in this study ranged from 0.5 to 10 ng/ mL, stratified based on hours after birth (Table 1). It is worth noting that the PCT discontinuation or continuation recommendation per protocol was overruled in 25% of neonates in the experimental arm. A 22.4-hour reduction in antibiotics exposure was observed in an earlier single-center study with 121 neonates (61 in control arm and 60 in experimental arm) (98). The study criteria and design were the same as the NeoPIns trial; however, a single <10 ng/mL PCT cutoff was used in this study. Additionally, the sample size was not sufficient to assess safety measures. One of the limitations of the NeoPIns trial is that this study included only neonates >34 weeks of gestational age, and the utility of PCT in preterm infants is unknown.
|
Table 1. Normal hourly values of post-birth PCT.
|
| Time after birth (hours) |
PCT (ng/mL)a |
|
0-6
|
0.5
|
| 6-12 |
2 |
|
12-18
|
5
|
| 18-36 |
10 |
|
36-48
|
5
|
| 48-60 |
2 |
|
60-72
|
1
|
| >72 |
0.5 |
|
aPCT cutoffs used in NeoPIns trial (97).
|
A similar reduction of antibiotic exposure has been reported in children <18 years old. A single-center study from Spain examined the impact of implementation of a PCT-guided protocol in antibiotic decision-making (99). One hundred fourteen patients were examined prior to implementation of the protocol and 112 after implementation. Antibiotics were discontinued if there was a 50% decrease in PCT value or PCT values dropped below <0.5 ng/mL. Implementation of this PCT-guided protocol resulted in a reduction of 1.1 days of antibiotic exposure without adverse outcomes. The compliance of antibiotic de-escalation in the PCT protocol was only 54.8%; however, prior to PCT implementation, de-escalation only occurred in 26% of the patients. Using a PCT cutoff of <0.25 ng/mL in the pediatric LRTI population has also demonstrated a reduction in antibiotic exposure (95, 96).
The studies evaluating the role of PCT for antibiotic cessation are limited in pediatric populations, and further investigation is warranted. Overall, the studies to date suggest that there is a role for PCT in guiding discontinuation of antibiotics in both neonatal and pediatric populations. Though the studies did not report any adverse outcomes, the rate of reinfection or death in the control arms was too low for the impact to be assessed.
Key summary points
- PCT should not be used as a stand-alone test for the diagnosis of sepsis or to guide antibiotic initiation in pediatric patients.
- PCT can guide safe cessation of antibiotics in neonates and pediatric patients with suspected sepsis who show clinical improvement.
- In neonates, PCT concentrations rise and fall rapidly, thus cutoffs need to be stratified by age (hours after birth).
- There is no consensus for PCT cutoffs or clearance rates to guide duration of antibiotic therapy in pediatric patients.
IS PCT AN ACCURATE PREDICTOR OF OUTCOMES (MORTALITY, RESPIRATORY FAILURE, SHOCK) IN PEDIATRIC POPULATIONS?
A few studies have examined the role of PCT as a prognostic predictor in pediatric populations. As with adult populations, higher PCT concentrations are associated with sepsis severity and increased risk of death (100-103). Conversely, low or normal PCT values have excellent negative predictive values for adverse outcomes. In an observational prospective study of 65 children with meningococcal infections, patients with PCT concentrations <10 ng/mL survived, whereas all patients with PCT > 10 ng/mL developed multiple organ dysfunction syndrome or died (104). Another study looking at PCT kinetics in pediatric patients with systemic inflammatory response syndrome and organ failure after open heart surgery showed similar outcomes, where PCT concentrations <10 ng/mL post-surgery survived (105).
Outcomes from Single PCT Measurements
Single PCT measurements at admission cannot predict the likelihood of a patient developing severe sepsis or septic shock. In a retrospective single-center study evaluating 109 critically ill children who had a PCT measurement within 48 hours of admission, 61 patients with septic shock had a median PCT concentration of 7.16 ng/mL with an IQR of 2.21 to 42.28 ng/mL, whereas another 48 patients without septic shock had a median PCT concentration of 0.91 ng/mL and an IQR of 0.10 to 10.80 ng/mL (91). Though PCT concentrations were higher in patients who progressed to severe sepsis or septic shock, there was significant overlap in PCT concentrations between the 2 groups. Therefore, PCT measurements alone are unable to predict probability of developing severe sepsis or septic shock. Similarly, in another study of 64 patients with meningococcal sepsis and septic shock, median PCT levels on admission were higher in children with septic shock compared to children with sepsis (270 ng/mL and 64.4 ng/mL, respectively). However, in this study there was no significant difference in PCT ranges for survivors (n = 42, 5.7-672.3 ng/mL) and nonsurvivors (n = 13, 55646.4) with septic shock (106). Similarly, in a study of 75 children with septic shock, though nonsurvivors had higher PCT concentrations (median 273 ng/mL for nonsurvivors vs 82 ng/mL for survivors), the range of PCT concentrations among survivors and nonsurvivors was similar (3.3-759.8 ng/mL and 5.1-736.4 ng/mL, respectively). The maximum length of ICU stay in this study was 32 days (100).
Outcomes from Sequential PCT Measurements
Hatherill and colleagues also evaluated changes in PCT concentrations after treatment. They found that of 39 children with sequential PCT measurements, 16 (41%) showed no fall in PCT after 24 hours of treatment, and the observed mortality in this group was 44% compared to 9% in 23 patients who showed a decline (100). The RESOLVE phase III trial examined the biomarker response in children with severe sepsis after treatment with either placebo or Drotrecogin alfa. In this study, 251 survivors showed a decline in PCT concentrations compared to the 37 nonsurvivors who showed an increase in PCT concentrations 24 hours post-treatment regardless of whether patients were in the trial or control arm (107). Overall, these studies demonstrated that a decline in PCT values after treatment is associated with better survival rates; however, the percent change in PCT concentrations were not provided in these studies. Poddar et al. evaluated whether reduction in PCT can predict 28-day mortality in 20 children admitted to the PICU with severe sepsis or septic shock. Of the 14 children who survived to 28 days, the percent reduction in PCT was 75.5% compared to a 200% increase in PCT concentrations in the 6 nonsurvivors between day of admission and 72 to 96 hours later(108).
Given the limited number of patients evaluated in these studies and the low rate of mortality, larger studies are needed to determine extent of PCT reduction required to accurately predict mortality in pediatric patients. Additionally, outcomes assessment was only a secondary measure assessed in most of these studies, and therefore details of PCT kinetics and percent reduction were largely missing.
Key summary points
- An elevated PCT is generally suggestive of a worse outcome in pediatric patients with severe sepsis or septic shock.
- A single PCT measurement has limited prognostic value since many studies have shown significant overlap in PCT concentrations among survivors and nonsurvivors.
- Serial PCT measurements may be predictive of mortality during ICU stay; however, additional studies are needed to define interpretive criteria in pediatric and neonatal patients.
WHEN AND HOW OFTEN SHOULD PCT BE MEASURED? WHICH CUTOFF(S) SHOULD BE USED?
PCT-guided algorithms have been investigated to optimize antimicrobial therapy and predict outcomes including mortality, disease progression, and length of stay. This strategy has safely reduced antibiotic treatment in septic patients in different clinical settings (i.e., ED, ICU) and various etiologies, particularly respiratory infections (Supplemental Table 1 and 2). However, recent trials did not confirm these findings (17-20, 38). Algorithms evaluated across studies differ in positive cutoff(s), timing of serial testing, and PCT assays used. Commonly, PCT algorithms consist of recommendations to initiate or discontinue antibiotics, typically using different cutoffs based on acuity, clinical setting (i.e., ED, ICU), and patient population.
Timing and Frequency for Antibiotic Initiation and Cessation in Adults
The recommended PCT cutoff tiers for patients in the ED and hospital wards are <0.1, 0.1 to 0.25, 0.26 to 0.5, and >0.5 ng/mL (Supplemental Tables 1 and 2). In patients with uncertain clinical suspicion of infection, PCT concentrations <0.1 and 0.1 to 0.25 ng/mL indicate that initiation of antibiotics is strongly discouraged and discouraged, respectively. However, if there is no clinical improvement, the studies referenced in Supplemental Tables 1 and 2 support that PCT should be rechecked after 6 to 24 hours. PCT concentrations 0.26 to 0.5 and >0.5 ng/mL indicate that antibiotics are encouraged and strongly encouraged, respectively, and remeasuring PCT every 2 to 3 days to assess for the opportunity of discontinuation of antibiotics is recommended. Upon re-evaluation, PCT concentrations <0.1 and 0.1 to 0.25 ng/mL strongly encourages continuation and discontinuation of antibiotics, respectively. When PCT drops by >80% from its peak value, antibiotic discontinuation is also recommended. PCT concentrations 0.26 to 0.5 and >0.5 ng/mL discourage and strongly discourage discontinuing antibiotics, respectively. A simplified approach for patients with moderate illness outside of the ICU consists of empiric antibiotic initiation based on clinical practice guidelines and initial assessment or, if PCT is 0.25 ng/mL, measuring PCT at least daily and stopping antimicrobial therapy if PCT decreases to <0.25 ng/mL or by at least 80% from peak concentration combined with improvement of clinical symptoms (109). Not surprisingly, different RCTs attempting to assess the feasibility of using PCT for initiating or discontinuing antibiotics across different patient populations, and settings have utilized different algorithms and cutoffs, as discussed earlier. Less is known about the broader applicability of these algorithms for predicting other outcomes such as mortality.
Timing and Frequency for Outcomes Prediction in Adults
In the United States, most PCT assays were initially FDA cleared to predict disease progression. More recently, some intended uses have expanded to mortality risk assessment and antibiotic management decision-making. A higher 28-day risk of all-cause mortality is predicted in patients with PCT concentrations that increase or decline < 80% from the day severe sepsis or septic shock was first diagnosed (day 0) or day 1 to day 4 (63). In this context, the main overlap with the cutoffs from the antibiotic initiation/cessation algorithms discussed previously is the assessment of PCT clearance in patients with high acuity disease. Not all studies that demonstrated an association between PCT concentrations at presentation and 28/30-day mortality reported a concentration cutoff, and those that did used a variety of cutoffs, complicating our ability to recommend an evidence-based cutoff for mortality prediction. Moreover, reported cutoffs differ across patient populations and diseases.
Some studies used a cutoff of 0.25 ng/mL (60, 109), while others used cutoffs such as those described earlier for antimicrobial stewardship (i.e., 0.1, 0.25, 0.5, 2.0 ng/mL) (50, 56), and others reported a variety of cutoffs (51, 54, 55) (Supplemental Table 3). The study by Kutz and colleagues, a meta-analysis of 14 trials, found an association between increasing PCT concentrations at presentation and adverse outcomes such as treatment failure and mortality but only in ED patients and in patients with ARI and CAP but not in ICU or primary care settings. A cutoff of 0.1 ng/mL resulted in sensitivities of 86.1 (95% CI, 82.4-89.3) and 92.5% (95% CI, 86.2-96.5) in ED patients for treatment failure and mortality, respectively, and >90% for mortality in patients in the ICU or with ARI or CAP. For these same parameters, specificity approaches 80% at a PCT cutoff of 2.0 ng/mL. Similarly, a multinational prospective study evaluating several PCT cutoffs (0.05, 0.1, 0.25, 0.5 ng/mL) in samples collected at ED admission from nearly 7000 patients showed association between 30-day mortality and increasing PCT concentrations (56). The study reported OR of 7.31 (95% CI, 3.3214.75) for patients with an admission PCT >0.5 ng/mL. In comparison, samples with PCT < 0.1 ng/mL or <0.05 ng/mL had OR of 1.71 (95% CI, 0.87-3.34) and 1.0, respectively. A large multi-center prospective study of more than 1700 patients with septic shock and PCT measured in the ED at diagnosis derived an optimal PCT cutoff of 0.17 ng/mL but found that PCT was not an independent predictor of 28-day mortality (62). In their study of severely ill trauma patients, those with PCT of 5 ng/mL or greater were at higher risk of dying (OR 3.65; 95% CI, 1.03-12.9) (55). A study in patients with tuberculosis reported that baseline PCT concentrations >0.13 ng/mL predicted mortality with OR of 7.9 (95% CI, 3.2-19.7); however, reported cutoffs for mortality ranged from 0.05 to 0.12 on days 7, 14, and 28, highlighting the need for a simplified approach to integrating PCT into mortality prediction, such as an integrated risk score.
Change in PCT Concentrations over Time to Predict Outcomes in Adults
The MOSES study found that while baseline PCT was a poor predictor of 28-day mortality (AUC 0.56;95% CI, 0.51-0.60), failed PCT clearance (<80%) between baseline and day 4 doubled the mortality (63). On day 1, mortality was 3-fold lower in patients with decreased PCT (29% vs 12%), regardless of the initial PCT concentration. In a study in patients with intra-abdominal sepsis, 5-day 70% PCT clearance predicted mortality while PCT clearance at days 3 and 4 did not differentiate survivors and nonsurvivors (64). Lower PCT clearance cutoffs have also been reported to effectively predict mortality. Elke et al. demonstrated that patients with PCT clearance by 20% at day 1 or by 50% at day 4 had lower mortalities in the ICU and in-hospital (16.8% and 24.1% vs 28.9% and 30.4%, respectively) (52). In patients with autoimmune disease, PCT peak concentrations did not differ between survivors and nonsurvivors while PCT clearance on days 5 and 7 was significant (P = 0.06 and 0.005, respectively) (61). In this study, clearance was calculated from the PCT peak concentration, an approach difficult to operationalize as it is challenging to predict when the peak PCT will occur prospectively.
The value of both PCT concentrations and clearance for 28/30-day, ICU, or in-hospital mortality prediction was evaluated in a meta-analysis, which included 23 studies (up to 2014) with 3994 patients (51). The studies associating absolute values of PCT with mortality included different clinical settings (ED and various ICUs) and PCT cutoffs (0.1214.27 ng/mL). For the evaluation of PCT clearance, the studies were mostly ICU (one surgical ICU) and the clearance cutoffs ranged from 25% to 70%. In both cases, sample size and mortality varied significantly. The AUCs were 0.77 (95% CI, 0.73-0.80) and 0.79 (95% CI, 0.75-0.83) for a single PCT concentration vs PCT clearance, respectively. Nonclearance is associated with a relative risk for mortality of 3.05 (95% CI, 2.35-3.95). The meta-analysis provides helpful insight into the value of PCT for mortality prediction but does not help elucidate the optimal cutoff to use or the definition of clearance and time points used.
Unfortunately, the degree of heterogeneity in these studies is significant (82). With such heterogeneity and inconsistency across studies, it is difficult to make a uniform recommendation regarding the utility of PCT in predicting prognosis. Further, even if a consistent cutoff for the PCT delta calculation were identified to predict 28-day mortality, it is unclear as to whether these predictions have any impact on patient care. Additional studies are needed to establish standardized cutoffs and/ or PCT clearance parameters in the prediction of 28-day mortality and to determine the clinical utility of a 28-day mortality prediction in patients with sepsis and LRTI patients.
Timing and Frequency for Antibiotics Initiation and Cessation in Pediatric Patients
The majority of evidence described earlier in the pediatric populations demonstrates that PCT has some utility in identifying patients with sepsis and severe bacterial infections;however, PCT does not have adequate sensitivity to serve as a stand-alone test to guide decisions on antibiotic therapy initiation. A meta-analysis consisting of more than 7000 children showed that a PCT cutoff of 0.5 ng/mL had a sensitivity of only 55% (specificity 85%) for detecting serious bacterial infections, and the negative predictive value ranged from 79.5% to 96.7% (86). A prospective study of 64 PICU patients showed that a PCT cutoff of 2.5 ng/ mL at admission had optimal sensitivity and specificity (68% and 74%, respectively), with a negative predictive value of 78%, whereas a CRP cutoff of 40 mg/L had a sensitivity of 95% and specificity of 42% with a negative predictive value of 94% (89). Another study of 85 PICU patients demonstrated a negative predictive value of 90% for ruling out bacterial infection in patients with systemic inflammatory response syndrome when PCT and CRP were used together, with a CRP cutoff of <4 mg/ DL and PCT cutoff of <1.75 ng/mL measured <4 hours after initiation or expansion of antibiotics (90). A retrospective analysis of 600 PICU patients reported a negative likelihood ratio of 0.3 for PCT using a cutoff of <0.1 ng/mL. When used in combination with a CRP < 0.8 mg/dL, the negative likelihood ratio was 0.1 for bacterial infection (91).
A meta-analysis of 2600 neonates showed that using PCT in combination had a sensitivity of 91% for detecting neonatal sepsis compared to using CRP and PCT alone, with a sensitivity of 71% and 85%, respectively. The cutoff intervals for PCT proposed by subanalysis was 0.5 to 2 ng/ mL, and a cutoff value of >10 mg/L for CRP yielded the highest sensitivity and specificity (87). Due to the rapid changes in PCT concentrations in neonates, caution should be used for assigning an absolute PCT cutoff in neonates <72 hours of age. As in the pediatric population, the cutoff for PCT used to detect bacterial infections varies by study in neonates and will be dependent on the algorithmic approach. For example, in the prediction rule described by Kuppermann and colleagues to rule out serious bacterial infections in infants, a PCT concentration of <1.71 ng/mL was used in conjunction with a negative urinalysis result and absolute neutrophil count of <4090/^L (92). Collectively, these studies suggest that PCT in combination with CRP has superior performance in ruling out bacterial infection compared to PCT measurements alone in both pediatric and neonatal populations. However, the timing of PCT measurement and proposed cutoffs vary greatly study to study. Overall, the major limitations for comparing studies examining the value of PCT in detecting sepsis or bacterial infections are a lack of a uniform definition for sepsis, varied inclusion and exclusion criteria, and lack of harmonized criteria for time of sampling and interpretation.
The NeoPIns trial provides the strongest evidence and guidance for cessation of antibiotics in neonates >34 weeks of gestational age and with onset of sepsis within the first 72 hours of life. In the trial when PCT concentrations fell within the normal range for the age (Table 1), antibiotics were discontinued. PCT was measured at 12, 24, 36 to 72 hours, and every 24 to 48 hours until discontinuation of antibiotics (97). The NeoPIns trial demonstrated a 22.4-hour reduction in antibiotic exposure. In children <18 years old, one single-center study evaluated a PCT reduction criteria of 50% or PCT decrease below 0.5 ng/mL. PCT was measured at baseline, 24, 48, and 72 hours of antibiotic treatment. Using this criteria for antibiotic cessation, a 1.1-day reduction in antibiotic exposure was observed without adverse outcomes (99). While more studies are needed in pediatric and neonatal populations, the evidence for PCT use in antibiotic cessation is encouraging.
Guidelines from the American Academy of Pediatrics on assessment of febrile well-appearing infants 8 to 60 days old recommend using PCT >0.5 ng/mL for initiating antibiotic treatment, citing evidence that PCT is an independent predictor of bacterial infections with better performance characteristics than CRP, absolute neutrophil count, and white blood cell count (110).
Timing and Frequency for Outcomes Prediction in Pediatric Patients
The prognostic ability of single increased PCT measurement is poor in predicting mortality, as the studies mentioned previously showed that even though the median PCT concentrations were higher in nonsurvivors compared to survivors, the ranges of PCT concentrations in both groups overlapped significantly (111). Thus, a PCT cutoff concentration for mortality predication cannot be recommended. As evidenced by the MOSES trial in the adult population, serial PCT measurements are likely more useful than single PCT measurements in predicting the risk of death in pediatric populations. However, large prospective multicenter studies examining the prognostic accuracy of PCT reduction are lacking for the pediatric population. Additionally, small sample sizes, low death rates, and differences in study design hinder the ability to make any conclusions on timing, frequency, cutoffs, and reduction for PCT measurements needed to make accurate predictions of mortality (100, 107). Only one single-center study evaluated the ability of serial PCT measurements 4 days apart to predict 28-day morality. The authors found that a 75.5% reduction in PCT concentrations was seen in survivors;however, the study size was small, consisting of only 20 children (14 survivors and 6 nonsurvivors) (108). It is also important to note that PCT is usually not the only factor in predicting mortality in septic ICU patients as other clinical information (cause of illness, other underlying conditions, and other test results) are considered.
Key summary points
- Decision thresholds for antimicrobial use/discontinuation vary by diagnosis and acuity and should considered in the context of other clinical signs and symptoms.
- No consistent PCT cutoff concentration has been established to predict mortality.
- Insufficient PCT clearance over time is associated with a significantly greater risk of 28- to 30-day mortality in septic and LRTI patients.
- No consistent PCT clearance calculation parameters have been established to predict 28- to 30-day mortality.
- Routine measurement of PCT to predict mortality is not recommended due to lack of consistent PCT cutoffs and/or PCT clearance parameters and insufficient evidence demonstrating a benefit to estimating 28-day mortality risk in septic and LRTI patients.
HOW SHOULD PCT BE INCORPORATED INTO ANTIMICROBIAL STEWARDSHIP EFFORTS?
As adherence to a predefined PCT algorithm has been reported to vary in real-world PCT studies, active antimicrobial stewardship intervention paired with PCT results may be needed. Other rapid diagnostic technology, primarily in microbial identification from cultures, has shown mortality benefit only when an antimicrobial stewardship intervention was paired with the result (112). Effective antimicrobial stewardship requires a multidisciplinary team effort involving infectious disease physicians, nurses, pharmacists, and laboratorians (113). The Center for Disease Control and Prevention's 2019 Core Elements of Hospital Antibiotic Stewardship Programs guidelines indicate that the use of procalcitonin might help identify patients in whom antibiotics can be stopped because bacterial pneumonia is unlikely (114). These guidelines indicate that laboratory and stewardship personnel can work collaboratively to present lab data in a way that supports optimal antibiotic use and is consistent with the institution's expected practices. Further, the laboratory can collaborate with stewardship program personnel to develop guidance for clinicians around clinical decision-making based on laboratory results.
We reviewed the literature for studies that assessed the effectiveness of incorporating PCT into antimicrobial stewardship efforts. Many of the reviewed studies describe providing extensive education and feedback to the prescribers and the development of a clinical decision pathway or algorithm to provide guidance prior to implementation of PCT at their institution (17, 29, 35, 115). Examples of how education was provided include didactic educational sessions, case reviews, and creation of pocket cards (115). Notification to the prescriber of the PCT result through text page or email with guidance on intHTMLerpretation of the result or prospective audit and direct feedback to the prescriber may provide benefit (38). Although the specific cutoff of PCT values to recommend antibiotic therapy varied among the studies published, tailoring and developing an institution-specific algorithm is important based on the patient population, type of infections, or level of acuity seen at the institution, as well as the analytical assay used. In the real-world clinical setting, overruling of an algorithm was commonly seen in critically ill patients, thus the development of different algorithms based on PCT interpretation in mild, moderate, or severe presentation with differing antibiotic recommendations based on severity may be warranted (109). As with any other antimicrobial stewardship intervention implemented at an institution, continued prospective audit with provider feedback on appropriate use and interpretation of PCT will likely be needed (116).
Moradi et al. describes the implementation of a clinical decision support tool to alert a prescriber in the electronic medical record in a pre- vs post- intervention quasi-experimental study (117). If the patient met 3 criteria: (1) had a positive viral PCR result by FilmArray® Respiratory Panel, (2) had a PCT result of <0.25 ng/mL, and (3) had one or more antibiotics ordered, an alert would populate when a prescriber opened the patient's chart indicating "the results suggest a viral infection, please reassess necessity of antibiotics as indicated." Without real-time intervention made by an infectious diseases physician or pharmacist, this intervention provided a significant decrease in inpatient antibiotic days of therapy (post- intervention mean 5.8 days vs 8 days, P < 0.001) and rate of discharge antibiotic prescription (post- intervention 20% vs 47.8%, P < 0.001) and duration of outpatient antibiotic therapy (0.9 days vs 2.4 days, P< 0.001). Antimicrobial stewardship programs should similarly implement strategic use of clinical decision support tools in conjunction with rapid diagnostic tools to optimize the use of PCT in antibiotic decision-making.
Key summary points
- Antimicrobial stewardship programs should implement strategic use of clinical decision support tools in conjunction with rapid diagnostic tools to optimize the use of PCT in antibiotic decision-making.
WHAT PREANALYTICAL FACTORS AFFECT PCT RESULTS AND/OR INTERPRETATION?
Acceptable Sample Types
The predominant sample used for the analysis of PCT is serum or plasma obtained from the collection of venous whole blood. Most data from regulatory filings of PCT assays suggest no difference between serum or plasma (EDTA, lithium heparin, sodium heparin) when using the acceptance criteria: slope = 1.0 ± 0.1, r2 > 0.95 (118122). Arterial samples have also been reported to yield comparable PCT values to venous samples (123). The validity of capillary blood samples is an important consideration for potential point-of-care testing applications of PCT, and one study showed that capillary and venous samples were comparable when analyzed on the same platform (slope = 1.01 [95% CI, 1.00-1.05], intercept = 0 [95% CI, 0-0], r2 = 0.98) (124). However, direct comparison between capillary blood on the investigated device and venous blood on reference methods showed greater bias, as discussed further later.
Stability and Storage
The only known enzymes to process PCT are found intracellularly, thus there is little known contribution of extracellular proteases to PCT degradation in vitro. Published data have shown no significant change in PCT concentration during room temperature storage for up to 24 hours (123, 125). PCT stability can be further prolonged by storage at lower temperatures, such as up to 5 days at 4°C and more than 2 weeks at < -20°C (123, 125, 126). Limited studies have demonstrated that up to 3 freeze-thaw cycles do not significantly impact PCT levels (123, 125).
Key summary points
- PCT shows excellent agreement between arterial and venous samples in common vacutainer tubes.
- Limited data suggest that capillary blood could be an acceptable PCT sample type, though more studies are required.
WHAT FDA-CLEARED METHODS ARE AVAILABLE TO MEASURE PCT AND HOW DO THEY COMPARE?
Numerous FDA-cleared immunoassays are available to measure PCT (Table 2). A detailed analytical overview of many of these assays has been provided by Schuetz and colleagues as well as the International Federation of Clinical Chemistry and Laboratory Medicine Working Group on Standardization of Procalcitonin Assays (127, 128). While many PCT assays were initially approved only for indications of risk assessment (e.g., for progression to severe sepsis and septic shock) and/or risk of 28-day all- cause mortality, most assays are now also approved for antibiotic therapy decision-making in patients with suspected or confirmed sepsis or LRTI (CAP, acute bronchitis, and AECOPD). We reviewed the literature to compile reported statistics from method correlation experiments performed between the various available PCT assays (Supplemental Table 5). For the purposes of this review, we considered the BRAHMS PCT-sensitive Kryptor to be the reference method, as it was an early-available method that was used in most of the initial clinical trials that first established PCT clinical decision points (39, 40). Our subsequent review of method correlation studies is divided into assays that use BRAHMS-licensed PCT reagents, Diazyme-licensed PCT reagents, and other PCT reagents.
BRAHMS PCT Assays
Ten published studies that compared various PCT assays to the BRAHMS PCT-sensitive Kryptor were included in our review (124, 125, 129-136). Nine of these studies included a test method(s) that utilized BRAHMS-licensed reagents, and these studies were performed across several immunoassay analyzers. For the BRAHMS assays, as compared to the Kryptor reference method, reported slopes ranged from 0.795 to 1.40, and correlation coefficients (r) ranged from 0.8864 to 0.997 (Supplemental Table 5). The Abbott ARCHITECT method repeatedly showed slight to moderate negative proportional biases across multiple studies (slopes ranged from 0.8060.97), while the bioMerieux VIDAS and MINI VIDAS consistently showed positive proportional biases (slopes ranged from 1.188-1.40). Correlation of the Roche Elecsys cobas methods to the Kryptor varied by the analyzer model; the lower-throughput e411 showed a negative proportional bias (slope = 0.795) while the higher-throughput e600 series and e801 exhibited slopes closer to 1. Intercepts that may be indicative of clinically significant onstant biases included the ADVIA Centaur (intercept = 0.40) and the cobas e 601 (intercept = -0.47). Other cobas analyzers did not demonstrate significant intercepts.
| TABLE 2. Features of POCT and laboratory testing hCG.a |
| Manufacturer (Platform) |
BRAHMS PCTa |
Diazyme PCTb |
Otherb |
| Abbott (Alinity) |
X |
|
|
| Abbott (Architect) |
X |
X |
|
| Beckman Coulter (AU) |
|
X |
|
| Beckman Coulter (Unicel, Access)& |
|
|
X (Access PCT) |
| bioMerieux (VIDAS) |
X |
|
|
| BRAHMS (Kryptor) |
X |
|
|
| DiaSorin (LIAISON) |
X |
|
|
| Diazyme (DZ-Lite) |
|
X |
|
| Fujirebio (Lumipulse) |
X |
|
|
| Orth-Clinical (VITROS) |
X |
|
|
| Roche (cobas) |
X |
X |
|
| Siemens (Atellica) |
X |
|
|
FDA-approved indications: a to aid in the risk assessment of critically ill patients on their first day of ICU admission for progression to severe sepsis and septic shock; to aid in assessing the cumulative 28-day risk of all-cause mortality for patients diagnosed with severe sepsis or septic shock in the ICU or when obtained in the emergency department or other medical wards prior to ICU admission, using a change in PCT level over time; to aid in decision-making on antibiotic therapy for patients with suspected or confirmed lower respiratory tract infections defined as community-acquired pneumonia, acute bronchitis, and acute exacerbation of chronic obstructive pulmonary disease in an inpatient setting or an emergency department; to aid in decision-making on antibiotic discontinuation for patients with suspected or confirmed sepsis.
b to aid in the risk assessment of critically ill patients on their first day of ICU admission for progression to severe sepsis and septic shock. |
Several of the studies further characterized method correlation by quantifying the percent agreement of categorical interpretation of PCT results relative to the Kryptor at commonly used clinical decision points. Dipalo et al. found optimal agreement ranging from 94% to 98% for the Centaur, cobas e601, LIASION, and VIDAS at the following concentrations: 0.5, 2.0, and 10.0 ng/mL (136). Similarly, Lippi et al. found agreement of 96% to 99% for the BRAHMS methods tested at 0.10, 0.25, 0.5, 2.0, and 10.0 ng/mL (130). Conversely, Gruzdys et al. found that an overall negative bias of the ARCHITECT method translated to predicted medical decision concentrations for the ARCHITECT that were significantly lower than their Kryptor counterparts, particularly at 0.50 and 2.00 ng/mL (125). However, not all ARCHITECT studies found reduced agreement at clinical decision points. The varied results of agreement studies are likely due, in part, to the small number of data points included within each concentration range.
A point-of-care testing method, BRAHMS PCT direct, showed reasonable correlation to the Kryptor lab-based method, more so in venous whole blood (slope = 0.98) than in capillary (slope = 0.90) samples (124). It should be noted that this study used a combination of both the BRAHMS PCT-sensitive Kryptor and Elecsys BRAHMS PCT assays as the reference method and did not distinguish between them for this analysis.
Diazyme PCT Assays
Four published studies were included that compared Diazyme PCT reagents on various immunoassay analyzers to the Kryptor method (129, 130, 133, 136). Reported slopes ranged from 0.6543 to 1.19, and correlation coefficients (r) ranged from 0.85 to 0.960 (Supplemental Table 5). Interestingly, the 2 most extreme slopes were generated from studies on the same analyzer (Roche cobas c 702), though the negative bias was generated from serum studies and the positive bias was generated from lithium-heparin plasma studies, each from separate investigators. Overall, correlation coefficients were lower with the Diazyme reagent methods than with the BRAHMS reagent methods. Analysis of categorial characterization often showed lower agreement at clinical decision points for the Diazyme assays than for the BRAHMS assays. For example, Dipalo et al. found agreement ranging from 83% to 86% at 0.5 ng/mL for 4 Diazyme methods, while agreement increased to 90% to 92% at 2.0 ng/mL and to 98% at 10.0 ng/mL (136). Similarly, Lippi et al. reported agreement between 83% (at 0.25 ng/mL) and 96% (10 ng/mL) (130).
Other PCT Assays
Assays not classified as using BRAHMS or Diazyme-licensed PCT reagents include the Beckman Access assays and Snibe MAGLUMI. One published study was included that compared each of these methods to the Kryptor method (130). While the Access methods showed reasonable agreement to the Kryptor method, the MAGLUMI showed a large positive proportional bias (slope = 1.51) that yielded overestimates from the Kryptor (Supplemental Table 5). Agreement with the Kryptor at clinical decision points was at least 96% across all concentrations (0.10, 0.25, 0.5. 2.0, and 10.0 ng/mL) for the Access assays, while agreement for the MAGLUMI ranged from 91% to 96%.
Key summary points
- BRAHMS-licensed PCT immunoassays have demonstrated good overall correlation with the Kryptor method and have shown high categorical agreement around common clinical decision points. Non-BRAHMS assays have generally shown reduced correlation to the Kryptor.
- Biases across methods may impact reference intervals and the interpretation of PCT results cross clinical decision ranges.
ARE CLINICAL DECISION POINTS (CUTOFFS) COMPARABLE ACROSS PCT ASSAYS?
While there is currently no true reference method for PCT, an assay's agreement with the BRAHMS PCT-sensitive Kryptor assay provides a basis to determine the feasibility of use of common PCT clinical decision points. Several published studies, described previously, demonstrate that while the various PCT methods generally compare to the BRAHMS PCT-sensitive Kryptor with reasonable agreement, there are minor to moderate biases in patient sample materials that suggest that method harmonization has not been achieved. These biases preclude PCT from being trended across multiple methods and require the use of assay-dependent reference intervals. Importantly, these biases also impact the interpretation of PCT results across clinical decision ranges, especially at low PCT concentrations, which have the highest implications for diagnostic purposes and antibiotic decision-making. Our review indicates that assays that use BRAHMS-licensed reagents have demonstrated stronger correlation to the BRAHMS PCT-sensitive Kryptor method than other assays that have been introduced more recently. The analytical differences observed in these correlation studies could be attributed to many factors, including the various detection methods used by the available immunoassays as well as the PCT antibodies used in the assay reagents. Assay manufacturers typically provide limited to no information regarding the antibody design or specific PCT epitopes targeted in their assays, though BRAHMS assays have been reported to employ 2 monoclonal antibodies on the calcitonin and katacalcin segments, respectively (127).
Notably, the International Federation of Clinical Chemistry and Laboratory Medicine has an active Working Group on Standardization of Procalcitonin Assays seeking to develop and validate standard reference materials and a reference measurement procedure for PCT by stable isotope dilution mass spectrometry (137). The International Federation of Clinical Chemistry and Laboratory Medicine Working Group on Standardization of Procalcitonin Assays has indicated that PCT assays belonging to the BRAHMS family participate in a harmonization program using the BRAHMS PCTsensitive Kryptor as a reference method, which supports our findings that BRAHMS assays correlate better with the Kryptor than non-BRAHMS assays (127). However, there remains a need for higher order reference material such that all PCT assays could be harmonized. In the meantime, laboratories seeking to newly implement PCT methods should perform robust accuracy studies to a reference method, preferably the BRAHMS PCT-sensitive Kryptor or a BRAHMS method, and should carefully consider the implications for clinical interpretation. Further, each laboratory should establish or verify a reference interval specific to the chosen platform. Laboratories should work closely with clinical colleagues, such as those in infectious diseases and on antimicrobial stewardship teams, to align PCT interpretive algorithms with the chosen analytical method.
Key summary points
- There is not yet a reference method for PCT. In the meantime, the BRAHMS PCT-sensitive Kryptor assay should be considered the gold standard since it was used in most of the initial clinical trials that first established PCT clinical decision points.
- The same PCT method should be used to trend PCT values for the same patient, as there is currently an absence of method harmonization and biases exist between current methods.
- Labs implementing PCT or changing PCT methods should verify or establish the reference interval of their method and perform robust correlation studies to the BRAHMS PCT-sensitive Kryptor or another BRAHMS method using patient samples across clinically relevant concentration ranges.
WHAT ARE POSSIBLE CONFOUNDING FACTORS FOR THE INTERPRETATION OF PCT RESULTS?
Proper interpretation of PCT results requires careful consideration of the patient's clinical condition and the myriad of factors that can influence PCT. While PCT is often used as a surrogate marker for bacterial infections, there are conditions where elevated PCT can be observed in the absence of bacterial infection. These clinical situations include inflammatory events such as severe trauma, various major surgeries, and cardiogenic shock. Patients under these circumstances typically require monitoring for systemic infection. However, PCT should be interpreted with caution in the context of these nonbacterial elevations, particularly if acute inflammatory conditions occur in between trended PCT measurements. While PCT may show general elevations in burns, some studies have suggested that PCT may still be able to distinguish septic from nonseptic burn patients (111, 138). Some nonbacterial infections, such as malaria and some fungal infections, have also shown to non-consistently elevate PCT (139, 140). PCT typically remains low in viral infections, as it is inhibited by interferon-y, and this is the basis for the proposed use of PCT to distinguish bacterial from viral infections. However, PCT elevations have been observed in some viral infections, including in patients with SARS-CoV-2 infection (141). The etiology of PCT elevation in some patients with severe COVID-19 is not well understood, and further studies are needed to determine the impact of other confounding factors, such as bacterial co-infection. Additionally, patients with significantly compromised renal function may not be able to clear PCT at a normal rate, and this can potentially cause PCT elevations (142). Finally, there is a natural elevation of PCT in healthy neonates just after birth (143). While there is growing evidence that PCT may have a role for guidance of antibiotic therapy in neonates, neonatal-specific reference ranges should be used. Generally, in cases of PCT elevations due to nonbacterial inflammatory processes, traditional PCT clinical decision points for outcome prediction and antimicrobial therapy decisions will not be valid. Alternatively, the kinetics (increases or decreases over time) of PCT may be monitored and considered in the context of potential background increases.
Key summary points
- Various clinical scenarios outside of bacterial infection may cause elevated PCT results, including trauma, surgery, shock, and renal dysfunction.
- PCT should be interpreted with caution in clinical settings of nonbacterial inflammatory processes and should not be trended around acute inflammatory events.
- Traditional PCT clinical decision points should not be used in the setting of nonbacterial PCT elevations.
- Age-specific reference ranges should be used to interpret PCT in neonates.
CONCLUSIONS
While the literature has accumulated with RCTs investigating the use of PCT, increasingly in the United States with the more recent availability of FDA-approved assays, there exists considerable variabilities in study designs and study populations that make it difficult to provide specific evidence-based recommendations for PCT protocols. In general, evidence to support the use of PCT to guide antibiotic cessation is compelling, particularly in the critically ill and in some LRTIs, but is lacking in other clinical scenarios. Current data on the utility of PCT to guide the initiation of antibiotics is limited and does not demonstrate a benefit. In the pediatric and neonatal populations, some studies have established a role for PCT-guided protocols in reducing antibiotic exposure; however, the utility of PCT has not yet been well-studied in preterm infants. While elevations in PCT are generally correlative with poor outcomes, no consistent PCT concentration(s) have been established to predict mortality. PCT interpretation guidance should consider the analytical method used, ideally its comparison to the BRAHMS Kryptor method, and patients should be trended using the same analytical assay. Improved outcomes from PCT implementation are more likely to be realized when the test is used in conjunction with antimicrobial stewardship programs, institutional interpretive algorithms, and clinical decision support tools. Successful implementation of clinical PCT requires a multidisciplinary effort among laboratorians, pharmacists, and infectious disease providers.
SUPPLEMENTAL MATERIAL
Supplemental material is available at The Journal of Applied Laboratory Medicine online.
Nonstandard Abbreviations: PCT, procalcitonin; FDA, Food and Drug Administration; LRTI, lower respiratory tract infection; RTI, respiratory tract infection; ICU, intensive care unit; RCT, randomized controlled trial; CRP, C-reactive protein; ED, emergency department; CAP, community-acquired pneumonia; AECOPD, acute exacerbation of chronic obstructive pulmonary disease; VAP, ventilator-associated pneumonia; OR, odds ratio; COPD, chronic obstructive pulmonary disease; AUC, area under curve; ARI, acute respiratory infection; MR-proADM, mid-regional proadrenomedullin; PICU, pediatric intensive care unit.
Author Contributions: The corresponding author takes full responsibility that all authors on this publication have met the following required criteria of eligibility for authorship: (a) significant contributions to the conception and design, acquisition of data, or analysis and interpretation of data; (b) drafting or revising the article for intellectual content; (c) final approval of the published article; and (d) agreement to be accountable for all aspects of the article thus ensuring that questions related to the accuracy or integrity of any part of the article are appropriately investigated and resolved. Nobody who qualifies for authorship has been omitted from the list.
Allison Chambliss (Conceptualization-Equal, Investigation-Equal, Methodology-Equal, Writing—original draft-Equal, Writing—review and editing-Equal); Khushbu Patel (Conceptualization-Equal, Data curation-Equal, Formal analysis-Equal, Validation-Equal, Writing —original draft-Equal, Writing—review and editing-Equal); Jessica Colon-Franco (Formal analysis-Equal, Investigation-Equal, Methodology-Equal, Writing—original draft-Equal, Writing—review and editing-Equal); Joshua Hayden (Conceptualization-Equal, Data curation-Equal, Formal analysis-Equal, Investigation-Equal, Methodology-Equal, Writing—original draft-Equal, Writing— review and editing-Equal); Sophie Katz (Conceptualization-Equal, Data curation-Equal, Investigation-Equal, Writing—original draft-Equal, Writing—review and editing-Equal); Emi Minejima (Conceptualization-Equal, Data curation-Equal, Formal analysis-Equal, Investigation-Equal, Writing—original draft-Equal, Writing—review and editing-Equal); and Alison Woodworth (Conceptualization-Equal, Data curation-Equal, Formal analysis-Equal, Methodology-Equal, Project administration-Equal, Visualization-Equal, Writing—original draft-Equal, Writing—review and editing-Equal).
Authors' Disclosures or Potential Conflicts of Interest: Upon manuscript submission, all authors completed the author disclosure form. Disclosures and/or potential conflicts of interest: Employment or Leadership: A.B. Chambliss, The Journal of Applied Laboratory Medicine, AACC; K. Patel, Clinical Chemistry, AACC; A. Woodworth, AACC Board of Directors; J.M. Colon-Franco, CLSI —Sepsis guidelines. Consultant or Advisory Role: A.B. Chambliss, Roche Diagnostics; S.E. Katz, Optum; J.M. Colon-Franco, Cytovale. Stock Ownership: None declared. Honoraria: A.B. Chambliss, AACC; S.E. Katz, Washington University St. Louis, East Tennessee Children's Hospital; A. Woodworth, AACC, Diasorin, Patient Centered Laboratory Utilization Guidance. Research Funding: S.E. Katz, Pfizer. Expert Testimony: None declared. Patents: None declared. Other Remuneration: A.B. Chambliss, support for attending meetings and/or travel from AACC; A. Woodworth, support for attending meetings and/or travel from Vizient. Role of Sponsor: The funding organizations played no role in the design of study, choice of enrolled patients, review and interpretation of data, preparation of manuscript, or final approval of manuscript.
REFERENCES
- Linscheid P, Seboek D, Nylen ES, Langer I, Schlatter M, Becker KL, et al. In vitro and in vivo calcitonin I gene expression in parenchymal cells: a novel product of human adipose tissue. Endocrinology 2003;144: 5578-84.
- Becker KL, Snider R, Nylen ES. Procalcitonin in sepsis and systemic inflammation: a harmful biomarker and a therapeutic target. Br J Pharmacol 2010;159:253-64.
- Meisner M. Pathobiochemistry and clinical use of procalcitonin. Clin Chim Acta 2002;323:17-29.
- Meisner M, Lohs T, Huettemann E, Schmidt J, Hueller M, Reinhart K. The plasma elimination rate and urinary secretion of procalcitonin in patients with normal and impaired renal function. Eur J Anaesthesiol 2001;18: 79-87.
- Huang H-B, Peng J-M, Weng L, Wang C-Y, Jiang W, Du B. Procalcitonin-guided antibiotic therapy in intensive care unit patients: a systematic review and meta-analysis. Ann Intensive Care 2017;7:114.
- Peng F, Chang W, Xie J-F, Sun Q, Qiu H-B, Yang Y. Ineffectiveness of procalcitonin-guided antibiotic therapy in severely critically ill patients: a meta-analysis. Int J Infect Dis 2019;85:158-66.
- Schuetz P, Wirz Y, Sager R, Christ-Crain M, Stolz D, Tamm M, et al. Procalcitonin to initiate or discontinue antibiotics in acute respiratory tract infections. Cochrane Database Syst Rev 2017;10:CD007498.
- Hey J, Thompson-Leduc P, Kirson NY, Zimmer L, Wilkins D, Rice B, et al. Procalcitonin guidance in patients with lower respiratory tract infections: a systematic review and meta-analysis. Clin Chem Lab Med 2018;56:1200-9.
- Odermatt J, Friedli N, Kutz A, Briel M, Bucher HC, Christ-Crain M, et al. Effects of procalcitonin testing on antibiotic use and clinical outcomes in patients with upper respiratory tract infections. An individual patient data meta-analysis. Clin Chem Lab Med 2017;56: 170-7.
- Bloos F, Trips E, Nierhaus A, Briegel J, Heyland DK, Jaschinski U, et al. Effect of sodium selenite administration and procalcitonin-guided therapy on mortality in patients with severe sepsis or septic shock: A randomized clinical trial. JAMA Intern Med. 2016;176:1266-76.
- de Jong E, van Oers JA, Beishuizen A, Vos P, Vermeijden WJ, Haas LE, et al. Efficacy and safety of procalcitonin guidance in reducing the duration of antibiotic treatment in critically ill patients: a randomised, controlled, open-label trial. Lancet Infect Dis 2016;16: 819-27.
- Annane D, Maxime V, Faller JP, Mezher C, Clec'h C, Martel P, et al. Procalcitonin levels to guide antibiotic therapy in adults with non-microbiologically proven apparent severe sepsis: a randomised controlled trial. BMJ Open 2013;3:e002186.
- Deliberato RO, Marra AR, Sanches PR, Martino MDV, Ferreira CEDS, Pasternak J, et al. Clinical and economic impact of procalcitonin to shorten antimicrobial therapy in septic patients with proven bacterial infection in an intensive care setting. Diagn Microbiol Infect Dis 2013; 76:266-71.
- Bouadma L, Luyt C-E, Tubach F, Cracco C, Alvarez A, Schwebel C, et al. Use of procalcitonin to reduce patients' exposure to antibiotics in intensive care units (PRORATA trial): a multicentre randomised controlled trial. Lancet Lond Engl 2010;375:463-74.
- Hochreiter M, Kohler T, Schweiger AM, Keck FS, Bein B, von Spiegel T, et al. Procalcitonin to guide duration of antibiotic therapy in intensive care patients: a randomized prospective controlled trial. Crit Care Lond Engl 2009;13:R83.
- Nobre V, Harbarth S, Graf J-D, Rohner P, Pugin J. Use of procalcitonin to shorten antibiotic treatment duration in septic patients: a randomized trial. Am J Respir Crit Care Med 2008;177:498-505.
- Huang DT, Yealy DM, Filbin MR, Brown AM, Chang C-CH, Doi Y, et al. Procalcitonin-guided use of antibiotics for lower respiratory tract infection. N Engl J Med 2018;379: 236-49.
- Daubin C, Valette X, Thiolliere F, Mira J-P, Hazera P, Annane D, et al. Procalcitonin algorithm to guide initial antibiotic therapy in acute exacerbations of COPD admitted to the ICU: a randomized multicenter study. Intensive Care Med 2018;44:428-37.
- Montassier E, Javaudin F, Moustafa F, Nandjou D, Maignan M, Hardouin J-B, et al. Guideline-based clinical assessment versus procalcitonin-guided antibiotic use in pneumonia: a pragmatic randomized trial. Ann Emerg Med 2019;74:580-91.
- Wussler D, Kozhuharov N, Oliveira MT, Bossa A, Sabti Z, Nowak A, et al. Clinical utility of procalcitonin in the diagnosis of pneumonia. Clin Chem 2019;65:1532-42.
- Layios N, Lambermont B, Canivet J-L, Morimont P, Preiser J-C, Garweg C, et al. Procalcitonin usefulness for the initiation of antibiotic treatment in intensive care unit patients. Crit Care Med 2012;40:2304-9.
- Jensen JU, Hein L, Lundgren B, Bestle MH, Mohr TT, Andersen MH, et al. Procalcitonin-guided interventions against infections to increase early appropriate antibiotics and improve survival in the intensive care unit: a randomized trial. Crit Care Med 2011;39: 2048-58.
- Shehabi Y, Sterba M, Garrett PM, Rachakonda KS, Stephens D, Harrigan P, et al. Procalcitonin algorithm in critically ill adults with undifferentiated infection or suspected sepsis. A randomized controlled trial. Am J Respir Crit Care Med 2014;190:1102-10.
- Meier MA, Branche A, Neeser OL, Wirz Y, Haubitz S, Bouadma L, et al. Procalcitonin-guided antibiotic treatment in patients with positive blood cultures: a patient-level meta-analysis of randomized trials. Clin Infect Dis 2019;69:388-96.
- Oliveira CF, Botoni FA, Oliveira CRA, Silva CB, Pereira HA, Serufo JC, et al. Procalcitonin versus C-reactive protein for guiding antibiotic therapy in sepsis: a randomized trial. Crit Care Med 2013;41:2336-43.
- Schuetz P, Wirz Y, Sager R, Christ-Crain M, Stolz D, Tamm M, et al. Effect of procalcitonin-guided antibiotic treatment on mortality in acute respiratory infections: a patient level meta-analysis. Lancet Infect Dis 2018;18: 95-107.
- Mockel M, de Boer RA, Slagman AC, von Haehling S, Schou M, Vollert JO, et al. Improve management of acute heart failure with ProcAlCiTonin in Europe: results of the randomized clinical trial IMPACT EU biomarkers in cardiology (BIC) 18. Eur J Heart Fail 2020; 22:267-75.
- Ni W, Bao J, Yang D, Xi W, Wang K, Xu Y, et al. Potential of serum procalcitonin in predicting bacterial exacerbation and guiding antibiotic administration in severe COPD exacerbations: a systematic review and meta-analysis. Infect Dis 2019;51:639-50.
- Bremmer DN, Moffa MA, Ma K, Bean HR, Snatchko J, Trienski TL, et al. Acute exacerbations of chronic obstructive pulmonary disease with a low procalcitonin concentration: impact of antibiotic therapy. Clin Infect Dis 2019;68:725-30.
- Branche AR, Walsh EE, Vargas R, Hulbert B, Formica MA, Baran A, et al. Serum procalcitonin measurement and viral testing to guide antibiotic use for respiratory infections in hospitalized adults: a randomized controlled trial. J Infect Dis 2015;212:1692-700.
- Long W, Deng X, Zhang Y, Lu G, Xie J, Tang J. Procalcitonin guidance for reduction of antibiotic use in low-risk outpatients with community-acquired pneumonia. Respirol Carlton Vic 2011;16:819-24.
- Schuetz P, Christ-Crain M, Thomann R, Falconnier C, Wolbers M, Widmer I, et al. Effect of procalcitonin-based guidelines vs standard guidelines on antibiotic use in lower respiratory tract infections: the ProHOSP randomized controlled trial. JAMA 2009;302:1059-66.
- Stolz D, Smyrnios N, Eggimann P, Pargger H, Thakkar N, Siegemund M, et al. Procalcitonin for reduced antibiotic exposure in ventilator-associated pneumonia: a randomised study. Eur Respir J 2009;34:1364-75.
- Christ-Crain M, Stolz D, Bingisser R, Muller C, Miedinger D, Huber PR, et al. Procalcitonin guidance of antibiotic therapy in community-acquired pneumonia. Am J Respir Crit Care Med 2006;174:84-93.
- Newton JA, Robinson S, Ling CLL, Zimmer L, Kuper K, Trivedi KK. Impact of procalcitonin levels combined with active intervention on antimicrobial stewardship in a community hospital. Open Forum Infect Dis 2019;6:ofz355.
- Akagi T, Nagata N, Wakamatsu K, Harada T, Miyazaki H, Takeda S, et al. Procalcitonin-guided antibiotic discontinuation might shorten the duration of antibiotic treatment without increasing pneumonia recurrence. Am J Med Sci 2019;358:33-44.
- Beye F, Vigneron C, Dargent A, Prin S, Andreu P, Large A, et al. Adhering to the procalcitonin algorithm allows antibiotic therapy to be shortened in patients with ventilator-associated pneumonia. J Crit Care 2019;53: 125-31.
- Branche A, Neeser O, Mueller B, Schuetz P. Procalcitonin to guide antibiotic decision making. Curr Opin Infect Dis 2019;32:130-5.
- Christ-Crain M, Jaccard-Stolz D, Bingisser R, Gencay MM, Huber PR, Tamm M, et al. Effect of procalcitonin-guided treatment on antibiotic use and outcome in lower respiratory tract infections: cluster-randomised, single-blinded intervention trial. Lancet Lond Engl 2004; 363:600-7.
- Briel M, Schuetz P, Mueller B, Young J, Schild U, Nusbaumer C, et al. Procalcitonin-guided antibiotic use vs a standard approach for acute respiratory tract infections in primary care. Arch Intern Med 2008;168:2000-7.
- Stolz D, Christ-Crain M, Bingisser R, Leuppi J, Miedinger D, Muller C, et al. Antibiotic treatment of exacerbations of COPD: a randomized, controlled trial comparing procalcitonin-guidance with standard therapy. Chest 2007;131:9-19.
- Corti C, Fally M, Fabricius-Bjerre A, Mortensen K, Jensen BN, Andreassen HF, et al. Point-of-care procalcitonin test to reduce antibiotic exposure in patients hospitalized with acute exacerbation of COPD. Int J Chron Obstruct Pulmon Dis 2016;11:1381-9.
- Aabenhus R, Jensen J-US, J0rgensen KJ, Hrobjartsson A, Bjerrum L. Biomarkers as point-of-care tests to guide prescription of antibiotics in patients with acute respiratory infections in primary care. Cochrane Database Syst Rev 2014;2014:CD010130.
- Tonkin-Crine SK, Tan PS, van Hecke O, Wang K, Roberts NW, McCullough A, et al. Clinician-targeted interventions to influence antibiotic prescribing behaviour for acute respiratory infections in primary care: an overview of systematic reviews. Cochrane Database Syst Rev 2017; 2017:CD012252.
- Engel MF, Paling FP, Hoepelman AIM, van der Meer V, Oosterheert JJ. Evaluating the evidence for the implementation of C-reactive protein measurement in adult patients with suspected lower respiratory tract infection in primary care: a systematic review. Fam Pract 2012;29:383-93.
- Cals JWL, Butler CC, Hopstaken RM, Hood K, Dinant G-J. Effect of point of care testing for C reactive protein and training in communication skills on antibiotic use in lower respiratory tract infections: cluster randomised trial. BMJ 2009;338:b1374.
- Butler CC, Gillespie D, White P, Bates J, Lowe R, Thomas-Jones E, et al. C-reactive protein testing to guide antibiotic prescribing for COPD exacerbations. N Engl J Med 2019;381:111-20.
- Prins HJ, Duijkers R, van der Valk P, Schoorl M, Daniels JMA, van der Werf TS, et al. CRP-guided antibiotic treatment in acute exacerbations of COPD in hospital admissions. Eur Respir J 2019;53:1802014.
- Rhee C, Dantes R, Epstein L, Murphy DJ, Seymour CW, Iwashyna TJ, et al. Incidence and trends of sepsis in US hospitals using clinical vs claims data, 2009-2014. JAMA 2017;318:1241.
- Kutz A, Briel M, Christ-Crain M, Stolz D, Bouadma L, Wolff M, et al. Prognostic value of procalcitonin in respiratory tract infections across clinical settings. Crit Care Lond Engl 2015;19:74.
- Liu D, Su L, Han G, Yan P, Xie L. Prognostic value of procalcitonin in adult patients with sepsis: a systematic review and meta-analysis. PloS One 2015;10:e0129450.
- Elke G, Bloos F, Wilson DC, Brunkhorst FM, Briegel J, Reinhart K, et al. The use of mid-regional proadrenomedullin to identify disease severity and treatment response to sepsis—a secondary analysis of a large randomised controlled trial. Crit Care 2018; 22:79.
- Saeed K, Wilson DC, Bloos F, Schuetz P, van der Does Y, Melander O, et al. The early identification of disease progression in patients with suspected infection presenting to the emergency department: a multi-centre derivation and validation study. Crit Care 2019;23:40.
- Osawa T, Watanabe M, Morimoto K, Okumura M, Yoshiyama T, Ogata H, et al. Serum procalcitonin levels predict mortality risk in patients with pulmonary tuberculosis: a single-center prospective observational study. J Infect Dis 2020;222:1651-4.
- Sakran JV, Michetti CP, Sheridan MJ, Richmond R, Waked T, Aldaghlas T, et al. The utility of procalcitonin in critically ill trauma patients. J Trauma Acute Care Surg 2012;73: 413-8.
- Sager R, Wirz Y, Amin D, Amin A, Hausfater P, Huber A, et al. Are admission procalcitonin levels universal mortality predictors across different medical emergency patient populations? Results from the multi-national, prospective, observational TRIAGE study. Clin Chem Lab Med 2017;55:1873-80.
- Shim B-S, Yoon Y-H, Kim J-Y, Cho Y-D, Park S-J, Lee E-S, et al. Clinical value of whole blood procalcitonin using point of care testing, quick sequential organ failure assessment score, C-reactive protein and lactate in emergency department patients with suspected infection. J Clin Med 2019;8:833.
- Yu H, Nie L, Liu A, Wu K, Hsein Y-C, Yen DW, et al. Combining procalcitonin with the qSOFA and sepsis mortality prediction. Medicine (Baltimore) 2019;98:e15981.
- Zhou H, Guo S, Lan T, Ma S, Zhang F, Zhao Z. Risk stratification and prediction value of procalcitonin and clinical severity scores for community-acquired pneumonia in ED. Am J Emerg Med 2018;36:2155-60.
- Castillo JGD, Wilson DC, Clemente-Callejo C, Roman F, Bardes-Robles I, Jimenez I, et al. Biomarkers and clinical scores to identify patient populations at risk of delayed antibiotic administration or intensive care admission. Crit Care Lond Engl 2019;23:335.
- Shi Y, Peng J, Hu X, Wang Y. The utility of initial procalcitonin and procalcitonin clearance for prediction of bacterial infection and outcome in critically ill patients with autoimmune diseases: a prospective observational study. BMC Anesthesiol 2015;15:137.
- Ryoo SM, Han KS, Ahn S, Shin TG, Hwang SY, Chung SP, et al. The usefulness of C-reactive protein and procalcitonin to predict prognosis in septic shock patients: a multicenter prospective registry-based observational study. Sci Rep 2019;9:6579.
- Schuetz P, Birkhahn R, Sherwin R, Jones AE, Singer A, Kline JA, et al. Serial procalcitonin predicts mortality in severe sepsis patients: results from the multicenter procalcitonin MOnitoring SEpsis (MOSES) study. Crit Care Med 2017;45:781-9.
- Peng J-C, Xu Q-Y, Ding J, Li Z, Wang J-M, Gao Y, et al. Usefulness of procalcitonin clearance to predict mortality in abdominal sepsis. Eur J Inflamm 2020;18: 2058739220942631.
- Zaccone V, Falsetti L, Nitti C, Gentili T, Marchetti A, Piersantelli MN, et al. The prognostic role of procalcitonin in critically ill patients admitted in a medical stepdown unit: a retrospective cohort study. Sci Rep 2020;10:4531.
- Stalenhoef JE, van Nieuwkoop C, Wilson DC, van der Starre WE, van der Reijden TJK, Delfos NM, et al.Procalcitonin, mid-regional proadrenomedullin and C-reactive protein in predicting treatment outcome in community-acquired febrile urinary tract infection. BMC Infect Dis 2019;19:161.
- Schuetz P, Hausfater P, Amin D, Amin A, Haubitz S, Faessler L, et al. Biomarkers from distinct biological pathways improve early risk stratification in medical emergency patients: the multinational, prospective, observational TRIAGE study. Crit Care Lond Engl 2015;19:377.
- Enguix-Armada A, Escobar-Conesa R, La Torre AG-D, De La Torre-Prados MV. Usefulness of several biomarkers in the management of septic patients: C-reactive protein, procalcitonin, presepsin and mid-regional pro-adrenomedullin. Clin Chem Lab Med 2016;54:163-8.
- Andaluz-Ojeda D, Nguyen HB, Meunier-Beillard N, Cicuendez R, Quenot J-P, Calvo D, et al. Superior accuracy of mid-regional proadrenomedullin for mortality prediction in sepsis with varying levels of illness severity. Ann Intensive Care 2017;7:15.
- Charles P-E, Peju E, Dantec A, Bruyere R, Meunier-Beillard N, Dargent A, et al. MR-proADM elevation upon ICU admission predicts the outcome of septic patients and is correlated with upcoming fluid overload. Shock Augusta Ga 2017;48:418-26.
- Onal U, Valenzuela-Sanchez F, Vandana KE, Rello J. Mid-regional pro-adrenomedullin (MR-proADM) as a biomarker for sepsis and septic shock: narrative review. Healthcare (Basel) 2018;6:110.
- Rhodes A, Evans LE, Alhazzani W, Levy MM, Antonelli M, Ferrer R, et al. Surviving sepsis campaign: international guidelines for management of sepsis and septic shock. Crit Care Med 2017;45:486-552.
- Nguyen HB, Rivers EP, Knoblich BP, Jacobsen G, Muzzin A, Ressler JA, et al. Early lactate clearance is associated with improved outcome in severe sepsis and septic shock. Crit Care Med 2004;32:1637-42.
- Choudhary R, Sitaraman S, Choudhary A. Lactate clearance as the predictor of outcome in pediatric septic shock. J Emerg Trauma Shock 2017;10:55.
- Jansen TC, van Bommel J, Schoonderbeek FJ, Sleeswijk Visser SJ, van der Klooster JM, Lima AP, et al. Early lactate-guided therapy in intensive care unit patients: a multicenter, open-label, randomized controlled trial. Am J Respir Crit Care Med 2010;182:752-61.
- Jones AE. Lactate clearance vs central venous oxygen saturation as goals of early sepsis therapy: a randomized clinical trial. JAMA 2010;303:739.
- Tian H, Han S, Lv C, Wang T, Li Z, Hao D, et al. [The effect of early goal lactate clearance rate on the outcome of septic shock patients with severe pneumonia]. Zhongguo Wei Zhong Bing Ji Jiu Yi Xue 2012;24:42-5.
- Gu W-J, Zhang Z, Bakker J. Early lactate clearance-guided therapy in patients with sepsis: a meta-analysis with trial sequential analysis of randomized controlled trials. Intensive Care Med 2015;41:1862-3.
- ThermoFisher Scientific. MR-proADM. https://www. mrproadm.com/about-mrproadm/brahms-mr-proadm. html(Accessed August 2021).
- Mearelli F, Barbati G, Casarsa C, Giansante C, Breglia A, Spica A, et al. The integration of qSOFA with clinical variables and serum biomarkers improves the prognostic value of qSOFA alone in patients with suspected or confirmed sepsis at ED admission. J Clin Med 2020;9:1205.
- Zhu Y, Li X, Guo P, Chen Y, Li J, Tao T. The accuracy assessment of presepsin (sCD14-ST) for mortality prediction in adult patients with sepsis and a head-to-head comparison to PCT: a meta-analysis. Ther Clin Risk Manag 2019;15:741-53.
- Arora S, Singh P, Singh PM, Trikha A. Procalcitonin levels in survivors and nonsurvivors of sepsis: systematic review and meta-analysis. Shock Augusta Ga 2015;43: 212-21.
- Singer M, Deutschman CS, Seymour CW, Shankar-Hari M, Annane D, Bauer M, et al. The third international consensus definitions for sepsis and septic shock (sepsis-3). JAMA 2016;315:801.
- Asirvatham AR, Menon U, Pavithran PV, Vasukutty JR, Kumar H, Bhavani N, et al. Role of procalcitonin as a predictor of clinical outcome in acute diabetic foot infections: a prospective study. Indian J Endocrinol Metab 2019;23:122-7.
- Yu H, Qi Z, Hang C, Fang Y, Shao R, Li C. Evaluating the value of dynamic procalcitonin and presepsin measurements for patients with severe sepsis. Am J Emerg Med 2017;35:835-41.
- Trippella G, Galli L, De Martino M, Lisi C, Chiappini E. Procalcitonin performance in detecting serious and invasive bacterial infections in children with fever without apparent source: a systematic review and meta-analysis. Expert Rev Anti Infect Ther 2017;15:1041-57.
- Ruan L, Chen G-Y, Liu Z, Zhao Y, Xu G-Y, Li S-F, et al. The combination of procalcitonin and C-reactive protein or presepsin alone improves the accuracy of diagnosis of neonatal sepsis: a meta-analysis and systematic review. Crit Care 2018;22:316.
- Casado-Flores J, Blanco-Quiros A, Asensio J, Arranz E, Garrote JA, Nieto M. Serum procalcitonin in children with suspected sepsis: a comparison with C-reactive protein and neutrophil count. Pediatr Crit Care Med 2003;4: 190-5.
- Simon L, Saint-Louis P, Amre DK, Lacroix J, Gauvin F. Procalcitonin and C-reactive protein as markers of bacterial infection in critically ill children at onset of systemic inflammatory response syndrome. Pediatr Crit Care Med 2008;9:407-13.
- Downes KJ, Weiss SL, Gerber JS, Klieger SB, Fitzgerald JC, Balamuth F, et al. A pragmatic biomarker-driven algorithm to guide antibiotic use in the pediatric intensive care unit: the optimizing antibiotic strategies in sepsis (OASIS) study. J Pediatr Infect Dis Soc 2017;6: 134-41.
- Lautz AJ, Dziorny AC, Denson AR, O'Connor KA, Chilutti MR, Ross RK, et al. Value of procalcitonin measurement for early evidence of severe bacterial infections in the pediatric intensive care unit. J Pediatr 2016;179: 74-81.e2.
- Kuppermann N, Dayan PS, Levine DA, Vitale M, Tzimenatos L, Tunik MG, et al. A clinical prediction rule to identify febrile infants 60 days and younger at low risk for serious bacterial infections. JAMA Pediatr 2019;173:342.
- Velasco R, Gomez B, Benito J, Mintegi S. Accuracy of PECARN rule for predicting serious bacterial infection in infants with fever without a source. Arch Dis Child 2021; 106:143-8.
- Stockmann C, Ampofo K, Killpack J, Williams DJ, Edwards KM, Grijalva CG, et al. Procalcitonin accurately identifies hospitalized children with low risk of bacterial community-acquired pneumonia. J Pediatr Infect Dis Soc 2018;7:46-53.
- Esposito S, Tagliabue C, Picciolli I, Semino M, Sabatini C, Consolo S, et al. Procalcitonin measurements for guiding antibiotic treatment in pediatric pneumonia. Respir Med 2011;105:1939-45.
- Baer G, Baumann P, Buettcher M, Heininger U, Berthet G, Schafer J, et al. Procalcitonin guidance to reduce antibiotic treatment of lower respiratory tract infection in children and adolescents (ProPAED): a randomized controlled trial. PloS One 2013;8: e68419.
- Stocker M, van Herk W, El Helou S, Dutta S, Fontana MS, Schuerman FABA, et al. Procalcitonin-guided decision making for duration of antibiotic therapy in neonates with suspected early-onset sepsis: a multicentre, randomised controlled trial (NeoPIns). Lancet Lond Engl 2017;390:871-81.
- Stocker M, Fontana M, El Helou S, Wegscheider K, Berger TM. Use of procalcitonin-guided decision-making to shorten antibiotic therapy in suspected neonatal early-onset sepsis: prospective randomized intervention trial. Neonatology 2010;97:165-74.
- Bobillo-Perez S, Sole-Ribalta A, Balaguer M, Esteban E, Girona-Alarcon M, Hernandez-Platero L, et al. Procalcitonin to stop antibiotics after cardiovascular surgery in a pediatric intensive care unit—the PROSACAB study. PLoS One 2019;14:e0220686.
- Hatherill M, Tibby SM, Turner C, Ratnavel N, Murdoch IA. Procalcitonin and cytokine levels: relationship to organ failure and mortality in pediatric septic shock. Crit Care Med 2000;28:2591-4.
- Rey C, Los Arcos M, Concha A, Medina A, Prieto S, Martinez P, et al. Procalcitonin and C-reactive protein as markers of systemic inflammatory response syndrome severity in critically ill children. Intensive Care Med 2007; 33:477-84.
- Han YY, Doughty LA, Kofos D, Sasser H, Carcillo JA. Procalcitonin is persistently increased among children with poor outcome from bacterial sepsis. Pediatr Crit Care Med 2003;4:21-5.
- Milcent K, Faesch S, Gras-Le Guen C, Dubos F, Poulalhon C, Badier I, et al. Use of procalcitonin assays to predict serious bacterial infection in young febrile infants. JAMA Pediatr 2016;170:62.
- Casado-Flores J, Blanco-Quiros A, Nieto M, Asensio J, Fernandez C. Prognostic utility of the semi-quantitative procalcitonin test, neutrophil count and C-reactive protein in meningococcal infection in children. Eur J Pediatr 2006;165:26-9.
- Celebi S, Koner O, Menda F, Balci H, Hatemi A, Korkut K, et al. Procalcitonin kinetics in pediatric patients with systemic inflammatory response after open heart surgery. Intensive Care Med 2006;32:881-7.
- Van der Kaay D, De Kleijn E, De Rijke Y, Hop W, De Groot R, Hazelzet J. Procalcitonin as a prognostic marker in meningococcal disease. Intensive Care Med 2002;28: 1606-12.
- Dalton HJ, Carcillo JA, Woodward DB, Short MA, Williams MD. Biomarker response to drotrecogin alfa (activated) in children with severe sepsis: results from the RESOLVE clinical trial. Pediatr Crit Care Med 2012;13:639-45.
- Poddar B, Gurjar M, Singh S, Aggarwal A, Baronia A. Reduction in procalcitonin level and outcome in critically ill children with severe sepsis/septic shock: a pilot study. J Crit Care 2016;36:230-3.
- Schuetz P, Beishuizen A, Broyles M, Ferrer R, Gavazzi G, Gluck EH, et al. Procalcitonin (PCT)-guided antibiotic stewardship: an international experts consensus on optimized clinical use. Clin Chem Lab Med 2019;57: 1308-18.
- Pantell RH, Roberts KB, Adams WG, Dreyer BP, Kuppermann N, O'Leary ST, et al. Evaluation and management of well-appearing febrile infants 8 to 60 days old. Pediatrics 2021;148:e2021052228.
- Cabral L, Afreixo V, Meireles R, Vaz M, Chaves C, Caetano M, et al. Checking procalcitonin suitability for prognosis and antimicrobial therapy monitoring in burn patients. Burns Trauma 2018;6:10.
- Timbrook TT, Morton JB, McConeghy KW, Caffrey AR, Mylonakis E, LaPlante KL. The effect of molecular rapid diagnostic testing on clinical outcomes in bloodstream infections: a systematic review and meta-analysis. Clin Infect Dis 2017;64:15-23.
- American Nurses Association and Centers for Disease Control and Prevention. Redefining the antibiotic stewardship team: recommendations from the American Nurses Association/Centers for Disease Control and Prevention Workgroup on the Role of Registered Nurses in Hospital Antibiotic Stewardship Practices. JAC-Antimicrob Resist. 2019;1:dlz037.
- Centers for Disease Control and Prevention. Core Elements of Hospital Antibiotic Stewardship Programs. https://www.cdc.gov/antibiotic-use/core-elements/ hospital.html (Accessed March 2022).
- Broyles MR. Impact of procalcitonin-guided antibiotic management on antibiotic exposure and outcomes: real-world evidence. Open Forum Infect Dis 2017;4:ofx213.
- Lindsay PJ, Rohailla S, Taggart LR, Lightfoot D, Havey T, Daneman N, et al. Antimicrobial stewardship and intensive care unit mortality: a systematic review. Clin Infect Dis 2019;68:748-56.
- Moradi T, Bennett N, Shemanski S, Kennedy K, Schlachter A, Boyd S. Use of procalcitonin and a respiratory polymerase chain reaction panel to reduce antibiotic use via an EMR alert. Clin Infect Dis 2019;71: 1684-9.
- US Food & Drug Administration. 510(k) Premarket Notification. https://www.accessdata.fda.gov/scripts/ cdrh/cfdocs/cfpmn/pmn.cfm?ID=K070310 (Accessed February 2021).
- US Food & Drug Administration. 510(k) Premarket Notification. https://www.accessdata.fda.gov/scripts/ cdrh/cfdocs/cfPMN/pmn.cfm?ID=55055 (Accessed February 2021).
- US Food & Drug Administration. 510(k) Premarket Notification. https://www.accessdata.fda.gov/scripts/ cdrh/cfdocs/cfpmn/pmn.cfm?id=K162297 (Accessed February 2021).
- US Food & Drug Administration. 510(k) Premarket Notification. https://www.accessdata.fda.gov/scripts/ cdrh/cfdocs/cfpmn/pmn.cfm?ID=K181002 (Accessed February 2021).
- US Food & Drug Administration. 510(k) Premarket Notification. https://www.accessdata.fda.gov/scripts/ cdrh/cfdocs/cfpmn/pmn.cfm?ID=K200236 (Accessed February 2021).
- Meisner M, Tschaikowsky K, Schnabel S, Schmidt J, Katalinic A, Schuttler J. Procalcitonin—influence of temperature, storage, anticoagulation and arterial or venous asservation of blood samples on procalcitonin concentrations. Eur J Clin Chem Clin Biochem 1997;35: 597-601.
- Kutz A, Hausfater P, Oppert M, Alan M, Grolimund E, Gast C, et al. Comparison between BRAHMS PCT direct, a new sensitive point-of-care testing device for rapid quantification of procalcitonin in emergency department patients and established reference methods—a prospective multinational trial. Clin Chem Lab Med 2016;54:577-84.
- Gruzdys V, Cahoon K, Pearson L, Lehman CM. Method verification shows a negative bias between 2 procalcitonin methods at medical decision concentrations. J Appl Lab Med 2019;4:69-77.
- Schuetz P, Christ-Crain M, Huber AR, Muller B. Long-term stability of procalcitonin in frozen samples and comparison of Kryptor® and VIDAS® automated immunoassays. Clin Biochem 2010;43:341-4.
- Huynh H-H, Breuf A, Vinh J, Delatour V, Delatour V, Breuf A, et al. Evaluation of the necessity and the feasibility of the standardization of procalcitonin measurements: activities of IFCC WG-PCT with involvement of all stakeholders. Clin Chim Acta 2021;515:111-21.
- Schuetz P, Bretscher C, Bernasconi L, Mueller B. Overview of procalcitonin assays and procalcitonin-guided protocols for the management of patients with infections and sepsis. Expert Rev Mol Diagn 2017;17:593-601.
- Dipalo M, Buonocore R, Gnocchi C, Picanza A, Aloe R, Lippi G. Analytical evaluation of diazyme procalcitonin (PCT) latex-enhanced immunoturbidimetric assay on Beckman Coulter AU5800. Clin Chem Lab Med 2015;53:593-7.
- Lippi G, Salvagno GL, Gelati M, Pucci M, Lo Cascio C, Demonte D, et al. Two-center comparison of 10 fully-automated commercial procalcitonin (PCT) immunoassays. Clin Chem Lab Med 2019;58:77-84.
- Soh A, Binder L, Clough M, Hernandez MH, Lefevre G, Mostert K, et al. Comparison of the novel ARCHITECT procalcitonin assay with established procalcitonin assay systems. Pr Lab Med 2018;12:e00110.
- Chambliss AB, Hayden J, Colby JM. Evaluation of procalcitonin immunoassay concordance near clinical decision points. Clin Chem Lab Med 2019;27:1414-21.
- Ceriotti F, Marino I, Motta A, Carobene A. Analytical evaluation of the performances of diazyme and BRAHMS procalcitonin applied to Roche cobas in comparison with BRAHMS PCT-sensitive Kryptor. Clin Chem Lab Med 2017;56:162-9.
- Dipalo M, Gnocchi C, Avanzini P, Musa R, Di Pietro M, Aloe R. Comparison of procalcitonin assays on KRYPTOR and LIAISON® XL analyzers. Diagnostics 2019;9:94.
- Dupuy AM, Ne M, Bargnoux AS, Badiou S, Cristol JP. Analytical evaluation of lumipulse® BRAHMS PCT CLEIA assay and clinical performances in an unselected population as compared with central lab PCT assay. Clin Biochem 2017;50:248-50.
- Dipalo M, Guido L, Micca G, Pittalis S, Locatelli M, Motta A, et al. Multicenter comparison of automated procalcitonin immunoassays. Pr Lab Med 2015;17: 22-8.
- IFCC. Standardization of Procalcitonin assays (WG-PCT). https://www.ifcc.org/ifcc-scientific-division/sd-working-groups/wg-pct (Accessed February 2021).
- Cabral L, Afreixo V, Almeida L, Paiva JA. The use of procalcitonin (PCT) for diagnosis of sepsis in burn patients: a meta-analysis. PloS One 2016;11:e0168475.
- Al-Nawas B, Shah P. Procalcitonin in acute malaria. Eur J Med Res 1997;2:206-8.
- Dornbusch HJ, Strenger V, Kerbl R, Lackner H, Schwinger W, Sovinz P, et al. Procalcitonin—a marker of invasive fungal infection? Support Care 2005;13:343-6.
- Lippi G, Plebani M. Procalcitonin in patients with severe coronavirus disease 2019 (COVID-19): a meta-analysis. Clin Chim Acta 2020;505:190-1.
- Meisner M, Tschaikowsky K, Hutzler A, Schick C, Schuttler J. Postoperative plasma concentrations of procalcitonin after different types of surgery. Intensive Care Med 1998;24:680-4.
- Chiesa C, Pellegrini G, Panero A, Osborn JF, Signore F, Assumma M, et al. C-reactive protein, interleukin-6, and procalcitonin in the immediate postnatal period: influence of illness severity, risk status, antenatal and perinatal complications, and infection. Clin Chem 2003; 49:60-8.