Can you imagine your laboratory participating in proficiency surveys that are not required for accreditation? If that thought isn’t bizarre enough, what if grading of these entirely voluntary surveys was much more stringent than today’s required surveys? You’d think this combination of features—entirely voluntary and difficult to pass—would relegate such surveys to commercial failure and total obscurity. Instead, this type of proficiency survey, called an accuracy-based survey by the College of American Pathologists (CAP), may in fact represent a new paradigm in advancing the quality of laboratory medicine.
To understand the importance of this potential change, here we review a few facts about traditional proficiency surveys, describe the concepts of matrix effects and harmonization, and discuss why accuracy is important for clinical laboratory measurements.
Traditional Proficiency Surveys in the U.S.
Originally designed as a voluntary exercise, proficiency testing (PT) was created to help ensure comparability of clinical test measurements among laboratories (1). Laboratories received samples from a central agency and were asked to report results on several measurands. In order to achieve a variety of concentrations, as well as to ensure stability, real patient samples were not used. Instead the PT samples typically contained processed and other added materials, including preservatives and spiked amounts of various measurands, to achieve a range of concentrations. In other words, these samples resembled control materials as a substitute for human serum.
Laboratorians knew, however, that different reagents and/or different instruments could give markedly different results on these samples, even though these same systems would provide matching results on real patient samples. The term “matrix effects” came to describe this difference (2). A perfect example of this effect can be found in data from a recent CAP 25-OH vitamin D survey (Table 1) (3). Using conventional survey material, the range of mean values for the four peer groups varied more than 2-fold, from 51–120 ng/mL on sample 1 and from 70–150 ng/mL on sample 2. In contrast, the range of mean values from these peer groups was only 25%, 24–30 ng/mL, on sample 3, the fresh frozen serum.
|
Table 1
Proficiency Testing Material Matrix Effects: 25-OH Vitamin D
|
| |
Sample 1 |
Sample 2 |
Sample 3 |
| Peer Group |
No. of
Labs |
Mean
(ng/mL) |
CV
% |
No. of
Labs |
Mean
(ng/mL) |
CV
% |
No. of
Labs |
Mean
(ng/mL) |
CV
% |
| 1 |
25 |
119.75 |
58.2 |
18 |
149.53 |
75.5 |
8 |
23.54 |
12.3 |
| 2 |
108 |
97.60 |
11.6 |
94 |
128.75 |
10.0 |
53 |
25.92 |
10.5 |
| 3 |
19 |
51.16 |
15.3 |
19 |
70.16 |
15.1 |
12 |
30.08 |
12.9 |
| 4 |
24 |
55.88 |
19.8 |
24 |
75.08 |
15.5 |
15 |
26.36 |
23.6 |
|
Samples 1 and 2 are conventional PT material, and sample 3 is minimally processed, fresh frozen human serum. Note that the ranges for the mean values of samples 1 and 2 are roughly 2-fold, whereas there’s only a 25% range in mean values for sample 3. Concluding from the conventional materials that peer group 1 gets 25-OH Vitamin D values that are twice as high as peer group 3 on real patient samples would be a mistake. If anything, as indicated by sample 3, its values are slightly lower on real patient material (23.54ng/mL versus 30.08ng/mL).
Adapted with permission from reference 3.
|
Such results, which have been observed for many years, indicated that laboratories using different analytic systems could not be expected to produce the same values on conventional PT samples. Consequently, survey organizations found it necessary to grade performance by peer groups, in other words, a group of laboratories using the same analysis method for a given measurand. According to this rationale, as long as a laboratory obtained answers comparable to other laboratories using the same method, the inference was that they were running their instruments correctly and the laboratory was deemed proficient. Whether the answers were correct was not the issue.
What about Grading?
Exactly how should performance be graded, even by peer group? And how close to the same value should laboratories in a peer group have to be in order to be deemed proficient? Assuming the results for any given measurand on any given specimen will be normally distributed, 95% of the laboratories should report results within 2 standard deviations (SD) of the mean value, and 99% within 3 SD.
With the passage of Clinical Laboratory Improvement Amendments (CLIA) ‘88, PT moved from a strictly quality assurance and improvement activity to a regulatory requirement, with penalties associated with unacceptable performance. Because it did not seem reasonable to give unacceptable grades to as many as 5% of laboratories on any given test, proficiency survey organizations adopted a criterion of 3 SDs for many of the measurands. In some cases, this goal was even mandated by law.
Table 2 provides a short list of current grading criteria used by CAP on its C-Survey, the comprehensive chemistry survey that encompasses many of the most common measurands. Being among the 99% of laboratories on any given challenge is hardly a badge of honor; nor is falling within 25–30% of the mean value, the criterion for some measurands. In other words, grading on traditional PT does not document excellent performance. Rather, the surveys detect laboratories that are real outliers so that they can correct serious deficiencies.
Table 2
Typical Proficiency Testing Grading Criteria |
| Measurand |
Target Value |
Range of
Acceptable Values |
Source for
Evaluation Criteria |
| Acetaminophen |
Peer Group |
± 3 SD |
CAP |
| Alkaline Phosphatase |
Peer Group |
± 30% |
CLIA |
| Cortisol |
Peer Group |
± 25% |
CLIA |
| Ferritin |
Peer Group |
± 3 SD |
CAP |
| Free Thyroxine |
Peer Group |
± 3 SD |
CLIA |
| HDL Cholesterol |
Peer Group |
± 30% |
CLIA |
| Ionized Calcium |
Peer Group |
± 3 SD |
CAP |
| Osmolality |
Peer Group |
± 3 SD |
CAP |
| Thyroxine Stimulating Hormone |
Peer Group |
± 3 SD |
CLIA |
| Total CO2 |
Peer Group |
± 3 SD |
CAP |
| Triglycerides |
Peer Group |
± 25% |
CLIA |
|
For each measurand, the target value, range of acceptable results, and the source of those grading criteria are listed. For example, CAP established that each laboratory’s results for acetaminophen are graded against the peer group mean and must fall within ±3 SD of that value to be deemed acceptable. In contrast, for alkaline phosphatase, CLIA states that each laboratory’s results must fall within 30% of the peer group mean.
Adapted with permission from the Participant Survey Report for Survey C (Comprehensive Chemistry/Therapeutic Drug Monitoring) of the College of American Pathologists (www.cap.org).
|
A Different Concept
But what if a laboratory wants to know if its results are accurate? For some assays, this is critically important, because physicians use national or even international guidelines to interpret test results and make treatment decisions. Examples of such assays include cholesterol, creatinine, hemoglobin A1c (HbA1c), testosterone, and vitamin D.
To assess the accuracy of its results, it would be important for the laboratory to use minimally processed human samples to avoid matrix effects. Let’s return to the 25-OH vitamin D data in Table 1 to see what this means. With the fresh frozen serum sample, the mean values of the four peer groups were much closer to each other, which indicates that the assays were reasonably well harmonized. But this information does not provide the true value for that sample.
To make that assessment, the laboratory would need to analyze that same, minimally processed material using the measurand’s reference method. But running reference method determinations is difficult and expensive; therefore, not many laboratories run them routinely. Furthermore, a laboratory would not use a reference method for a PT exercise, as the purpose is to determine if its analysis method is harmonized with other laboratories.
Last year, CAP began offering an accuracy-based vitamin D survey (4), which included commutable or minimally processed materials, as well as the true 25-OH vitamin D level as determined using the reference method by the Centers for Disease Control and Prevention (CDC). The survey contained five serum samples with concentrations of 14.6–58.5 ng/mL. Of the roughly 150 laboratories participating, about 85%, representing three distinct peer groups, reported values within 25% of the true value (3).
Not Entirely New
Using minimally processed materials for PT is not entirely new nor only American. Other programs deserve credit, such as the London-based Vitamin D External Assessment Scheme (DEQAS), which has been using minimally processed, human serum samples and reference method measurements to assess the performance of its participating laboratories since 1989 (5).
In 1996, CAP’s GH2 survey for HbA1c began using pooled, whole-blood samples from patients with diabetes mellitus and including reference method determinations of the values. This survey allows laboratories to compare results not only to their peer group but also to the true value, which provides an assessment of the method’s accuracy.
Recently, CAP decided to change from peer-group grading to accuracy-based grading for the HbA1c survey. This means that even if the laboratory reports the mean value for its peer group, if that value is more than a fixed number from the true value, the laboratory receives an unsatisfactory grade.
One of the goals of this accuracy-based effort is to encourage manufacturers to improve their methods to the point where the results obtained in practice can be used to improve patient care. As shown in Figure 1, substantial progress has been made towards this goal over the past 15 years. Today, the vast majority of peer groups have mean values very close to the true value, and most laboratories in each peer group are well within 0.5% reporting units of the true value (2,4).
Figure 1
Accuracy of Hemoglobin A1c Assays
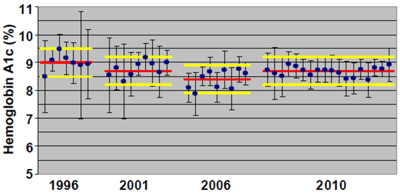 This figure shows the improvement in performance over the past 15 years on CAP's Accuracy-Based GH2 Survey for HbA1c. For each peer group, the mean value is represented by a solid blue circle, and the vertical error bars represent ±2 SD. The solid red line for each sample represents the target value, established by National Glycohemoglobin Standardization Program secondary reference laboratories. The two horizontal solid yellow lines for each sample represent a fixed difference of 0.5 % reporting units from the target value to facilitate viewing how close to the target values the individual peer groups were based on their means and SDs.
Used with permission from reference 2.
This figure shows the improvement in performance over the past 15 years on CAP's Accuracy-Based GH2 Survey for HbA1c. For each peer group, the mean value is represented by a solid blue circle, and the vertical error bars represent ±2 SD. The solid red line for each sample represents the target value, established by National Glycohemoglobin Standardization Program secondary reference laboratories. The two horizontal solid yellow lines for each sample represent a fixed difference of 0.5 % reporting units from the target value to facilitate viewing how close to the target values the individual peer groups were based on their means and SDs.
Used with permission from reference 2.
Where Accuracy Really Counts: Serum Creatinine
Accurate reporting of serum creatinine values is critical to a nationwide effort to detect chronic kidney disease in its earliest stages, when interventions can slow the progress of the disease or even reverse it. The National Kidney Disease Education Program (NKDEP) has encouraged laboratories to calculate and report estimated glomerular filtration rates (eGFRs) whenever serum creatinine is measured (6). The equation used for this calculation, however, was developed using one manufacturer’s creatinine assay. As discussed above, data from proficiency surveys show that test values are dependent on the laboratory’s choice of manufacturers’ assays, which in this case would change the reported eGFR and potentially enable a patient’s kidney disease to go undetected.
An analysis of creatinine PT data on minimally processed human serum samples was helpful in sorting out this problem (7). The data showed that conventional PT materials did not, in general, act like real human serum, sometimes even having biases in the direction opposite the direction of the bias on real serum (Figure 2). More importantly, errors in creatinine measurement translated to errors as high as 30% in the eGFR. In order to achieve adequate clinical accuracy for eGFR values, NKDEP set the goal for creatinine accuracy at 15%, but the analysis showed that only nine of 50 peer groups (18%) performed well enough to meet it.
Figure 2Proficiency Testing Results for Serum Creatinine
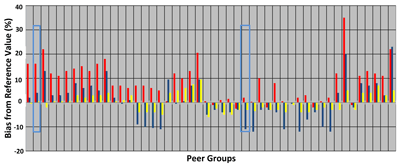 Each column consists of three bars and represents a single peer group's mean result on sample C-02 (red, fresh frozen serum), C-03 (blue, conventional survey material), and C-04 (yellow, conventional survey material). The reference measurement values for these three samples were 0.9, 0.8, and 2.2 mg/dL, respectively. The peer group highlighted in blue on the left had mean values on conventional materials well within 5% of the true value, but it was about 8% high on fresh frozen serum. In contrast, the peer group highlighted in blue on the right had a mean value for sample C-03 that was roughly 10% below the true value, whereas its mean value was right on the true value for sample C-02, the fresh frozen sample.
Adapted with permission from reference 7.
Each column consists of three bars and represents a single peer group's mean result on sample C-02 (red, fresh frozen serum), C-03 (blue, conventional survey material), and C-04 (yellow, conventional survey material). The reference measurement values for these three samples were 0.9, 0.8, and 2.2 mg/dL, respectively. The peer group highlighted in blue on the left had mean values on conventional materials well within 5% of the true value, but it was about 8% high on fresh frozen serum. In contrast, the peer group highlighted in blue on the right had a mean value for sample C-03 that was roughly 10% below the true value, whereas its mean value was right on the true value for sample C-02, the fresh frozen sample.
Adapted with permission from reference 7.
CAP continues to offer a creatinine accuracy-based PT (Linearity Survey LN24) with minimally processed serum samples, two of which are measured by the reference method. The others have creatinine values calculated from admixture ratios. For this discussion, it is important to re-emphasize the limitations of using materials with unknown commutability. Such surveys allow a laboratory to evaluate its individual performance, as well as the overall performance of its peer group. But if the mean value for the peer group is far from the true value, then even a laboratory matching the peer group mean value will be reporting inaccurate creatinine results, and therefore eGFRs, on patient samples.
In this type of situation, laboratories need to turn to manufacturers to enhance the performance of their assays. HbA1c is a good example of how manufacturers have improved assays, leading to more accurate monitoring of diabetes patients. Moreover, the laboratory community can monitor these improvements by reviewing accuracy-based surveys over time.
When the Majority Shouldn’t Rule: Testosterone
As noted earlier, matrix effects associated with conventional PT materials led to the now common practice of using the mean of each peer group as the target value for PT samples. On the other hand, when the samples being tested are real patient serum, accuracy should trump peer group means.
A recent CAP accuracy-based testosterone survey illustrates this point particularly well (8). The true testosterone value for one of four specimens collected from a woman was 7.4 ng/dL. A total of 50 laboratories submitted values for this sample, and each of those laboratories was evaluated against this true value. Because CAP requires a minimum of 10 laboratories to form a peer group, only two peer groups analyzed the sample, with both using automated immunoassays cleared by the Food and Drug Administration (FDA). The mean values for the two peer groups, comprising 18 and 17 labs, were 33.4 ng/dL (range 14–41ng/dL) and 20.2 ng/dL (range 8–39 ng/dL), respectively. In other words, the fact that a given laboratory reported the mean value for its peer group using one of these assays did not indicate it reported the correct result.
Clearly such results are a cause for concern. As indicated in the discussion accompanying the survey (8), these data underscore the need for laboratories to choose testosterone immunoassays carefully for testing of women and children, two populations with low levels of the hormone.
In contrast, this testosterone survey also indicated that the same assays performed reasonably well in conjunction with diagnosing male hypogonadism (9). For the samples from men, roughly 80% of laboratories achieved values within 14% of the true values of 351 ng/dL and 322 ng/dL, and approximately 96% were within 20%. In comparison, the traditional CAP proficiency survey for testosterone sets the target value as that of the peer group, and acceptable performance is defined as within 3 SD.
These survey results reinforce the need for manufactures to improve assay performance. Based on the experience with HbA1c, continued monitoring of this measurand with accuracy-based surveys should lead to marked improvements in laboratory performance over time.
The Path Forward
At this point, it seems natural to ask: Why don’t all proficiency surveys use minimally processed human samples or commutable materials? As noted earlier, it is much more expensive to produce these materials, and it also is difficult to achieve the needed concentration ranges. Given that most laboratories participate in PT only to fulfill the regulatory requirements, they most likely buy the least expensive product that meets their needs. In addition, since accuracy-based surveys are typically graded on the basis of clinical requirements, the grading criteria tend to be more stringent than those used in traditional proficiency surveys, which may be daunting for some laboratories.
On the other hand, it would be difficult for organizations that conduct proficiency surveys to supply sufficient commutable materials for every laboratory in the country. As an example, there are two forms of 25-OH vitamin D (D2 and D3). Some methods can distinguish the different forms; other methods vary in sensitivity to them. Accuracy-based proficiency surveys should be able to assess samples with varying concentrations of each. DEQAS has found it increasingly difficult to find real patient samples with high levels of the D2 form; because it refuses to manipulate the samples by spiking, it has been forced to offer fewer such samples each year. Faced with the same problem, CAP, with IRB approval , administers high doses of vitamin D2 to donors, making these samples much more expensive than traditional proficiency testing samples.
But it might not be necessary for every laboratory to participate in accuracy-based surveys. Laboratories running an FDA-cleared, standardized assay according to the manufacturer’s directions should do well using conventional PT for assessing how close their results are to the mean value. In this scenario, a laboratory could make a reasonable assessment about the accuracy of its results on patient samples if at least some of the peer group laboratories using that same method participate in an accuracy-based survey for that measurand and if the manufacturer is able and willing to collect the data and share it with laboratories. Returning to the testosterone example, this would mean that laboratories whose values on traditional proficiency surveys match the peer group perfectly could infer that the method would produce falsely high values on low testosterone samples.
Accuracy-based proficiency testing, however, would be highly recommended for laboratories using either tests that they have developed or FDA-cleared tests altered in any way. A particularly good example of this is mass spectrometry analysis of 25-OH vitamin D. Each laboratory’s method is slightly different; therefore, it doesn’t make sense to calculate a peer-group mean or to compare values. Instead, a laboratory would need to assess its method by comparing values to the true values offered by accuracy-based proficiency testing.
The Future
Today, accuracy-based proficiency testing is still in its infancy, but its concepts represent a bold step forward in helping the laboratory medicine community make a major advance in providing high quality diagnostic data. Beyond ensuring that each laboratory is running assays comparable to its peer group, accuracy-based proficiency testing ensures that each laboratory is reporting values that are accurate, enabling physicians to use national and international guidelines with confidence.
Participating in accuracy-based surveys is a must for laboratories that want to know how accurate their methods really are. Many laboratories already have taken the first steps into this new realm. The standard CAP HbA1c survey uses real, human, whole-blood samples and target values by reference methods, which allows laboratories to assess the accuracy of their survey values. For other measurands, the materials are somewhat limited at this time, and such surveys may represent an additional expense over traditional PT that laboratories cannot afford. Finally, accuracy-based PT also creates an opportunity for laboratories to work with manufacturers to get an idea of how accurate the method is.
REFERENCES
- Laessig RH, Ehrmeyer SS, Lanphear BJ, Burmeister BJ, et al. Limitations of proficiency testing under CLIA ’67. Clin Chem 1992;38:1237–1244.
- Miller WG, Jones GRD, Horowitz GL, Weykamp C. Proficiency testing/external quality assessment: current challenges and future directions. Clin Chem 2011;57:1670–1680.
- Measurements of 25-OH vitamin D. Accessed November 23, 2011. Available online.
- Little RR, Rohlfing CL, Sacks DB. Status of hemoglobin A1c measurement and goals for improvement: from chaos to order for improving diabetes care. Clin Chem 2011;57:205–214.
- DEQAS—Vitamin D External Quality Assessment Scheme. Accessed November 23, 2011. Available online.
- NKDEP National Kidney Disease Education Program. Accessed November 23, 2011. Available online.
- Miller WG, Myers GL, Ashwood ER, et al. Creatinine measurement: state of the art in accuracy and interlaboratory harmonization. Arch Pathol Lab Med 2005;129:297–304.
- Accuracy based testosterone and estradiol. Accessed November 23, 2011. Available online.
- Rosner W, Auchus RJ, Azziz R, Sluss PM, et al. Position statement: Utility, limitations, and pitfalls in measuring testosterone: An Endocrine Society position statement. J Clin Endocrinol Metab 2007;92:405–13.

Gary L. Horowitz, MD, is the director of Clinical Chemistry at Beth Israel Deaconess Medical Center and associate professor of Pathology at Harvard Medical School.
Email

William L. Roberts, MD, PhD, is the medical director of the Automated Core Laboratory and the Chemistry Group at ARUP Laboratories and professor of Pathology at the University of Utah.
Email
Disclosures: William L. Roberts has received grant/research support from Abbott and Beckman Coulter and salary/consultant fees from ARUP Laboratories.