In the past few years, new developments and insights in the field of patient moving average quality control (MA QC) have enabled the design of more efficient and powerful QC plans incorporating practical application of MA QC. Recently, several labs have implemented MA QC to support their analytical quality assurance in real-time mode(1-4).
To implement MA QC, several necessary steps can be identified(5). The first step is to determine appropriate MA QC settings, specifically: (i) the inclusion criteria for selecting samples and results to be entered into the MA QC algorithm, (ii) the algorithm to be used to calculate the MA QC, and (iii) the control limits that, when exceeded, trigger an MA QC alarm. For this purpose, the MA Generator system, which is available online for medical laboratories (see www.huvaros.com) can be used(6). MA Generator uses laboratory‑specific training sets, sets the control limits to produce a manageable number of alarms, and performs error‑detection simulations. The results of these simulations are then presented in the form of bias detection curves, which enable laboratory‑specific optimal MA QC procedures to be selected. Finally, the optimal MA QC procedure can then be presented in MA validation charts, which indicate the objectified error‑detection performance of the MA QC and the uncertainty thereof(7, 8). The latter can be used to design QC plans that incorporate internal QC and MA QC, or to avoid unnecessary internal QC measures(5, 9). Examples of these graphs are presented in Figures 1 and 2 (below).
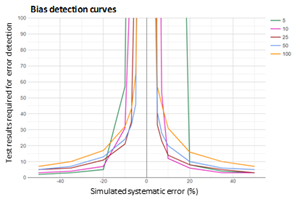
Figure 1: Bias detection curves used to optimize a calcium MA QC
Bias detection curves are plotted for five calcium MA procedures after running error detection simulation analyses using MA Generator. The MA QC procedures presented use mean calculation of the most recent 5,10, 25, 50 or 100 calcium results. The color coded lines present the median number of results needed for error detection. The bias detection curves are used to select the MA QC with the best error detection performance within an analytical run. y-axis scale is based on the analytical run size.
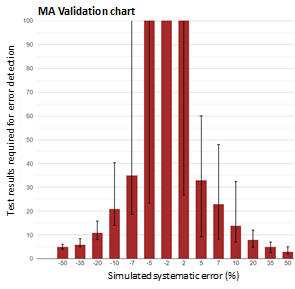
Figure 2: MA validation chart of a calcium MA QC.
MA validation chart obtained by MA Generator for a calcium MA QC procedure using a mean calculation of the most recent 25 test results. The red bars represent the median number of test results needed for error detection; the error bars represent the 95% interval of the number of test results needed for error detection.
The MA validation chart is used to validate the error detection performance of an MA QC procedure. For example, the above graph shows that a 10% positive error is detected with 50% probability (median) in 14 test results, and with 97.5% probability within 33 test results. Larger errors are detected within fewer test results. Y-axis scale is based on analytical run size; here the daily production number of tests run on the analyzer system. Error bars exceeding this scale indicate that these errors are not reliably detected (with > 97.5% probability) within an analytical run.
Once the optimal MA QC settings have been determined, these are then programmed on software systems capable of operating MA QC. Most labs have access to such software systems, as MA QC functionality is frequently integrated into analyzer software (especially for hemocytometry), middleware systems, or LIS systems. In general, critical aspects that need to be pre-configured in the software include: (i) selection of only patient samples for the MA QC procedures (exclusion of QC samples, dialysis fluids, research samples, etc.), (ii) real-time alarm notification functionality, and (iii) MA QC review in the appropriate accuracy graph, for which the MA QC “reference range” is obtained by applying the MA Generator methodology. The next implementation step is to design laboratory protocols that define how technicians should act on MA QC alarms. Protocol design is essential so that errors detected by MA QC can be recognized and appropriately acted on(10). Of course, the final steps of the implementation process should be training the technicians and then activating the system.
In a recent study, MA QC was implemented and operated in a cancer treatment center(4). QC plans were designed such that MA QC was applied when internal QC was found to be insufficient. MA QC was optimized using the MA Generator methodology and finally, for a total of 10 chemistry tests and 6 hematological tests, MA QC was implemented. The MA QC alarm protocol required (i) measurement of iQC, (ii) re-measurement of recent patient sample results, and (iii) review of results. To assess the feasibility and added value of MA QC, all MA QC alarms observed in the first 10 months after implementation were evaluated. The final observed alarm rate was 0.030%, with an MA QC alarm frequency of 0.67/day, which was considered feasible for routine practice. Furthermore, 26% of the alarms detected errors exceeding the total allowable bias criterion (TBa), 13.7% of them detected errors exceeding the total allowable error criterion (TEa), and 9.2% of the alarms triggered instant (technical) corrections. On two occasions, MA QC detected a major issue that resulted in either correcting patient results or removing one hemocytometry analyzer system from service. These results demonstrate the added value of using MA QC to support the analytical quality assurance and control processes.
REFERENCES
- Rossum HH, Kemperman H. Implementation and application of moving average as continuous analytical quality control instrument demonstrated for 24 routine chemistry assays. Clin chem Lab Med 2017;55(8):1142-51.
- Fleming JK, Katayev A. Changing the paradigm of laboratory quality control through implementation of real-time test results monitoring: For patients by patients. Clin Biochem 2015;48(7-8):508-13.
- Ng D, Polito FA, Cervinski MA. Optimization of a Moving Averages Program Using a Simulated Annealing Algorithm: The Goal is to Monitor the Process Not the Patients. Clin chem 2016;62(10):1361-71.
- van Rossum HH, van den Broek D. Ten-Month Evaluation of the Routine Application of Patient Moving Average for Real-Time Quality Control in a Hospital Setting. J Appl Lab Med. 2020;5(6):1184-93.
- van Rossum HH, van den Broek D. Design and implementation of quality control plans that integrate moving average and internal quality control: incorporating the best of both worlds. Clin chem Lab Med 2019;57(9):1329-38.
- MA Generator. Available from: www.huvaros.com.
- van Rossum HH, Kemperman H. Optimization and validation of moving average quality control procedures using bias detection curves and moving average validation charts. Clin Chem Lab Med 2017;55(2):218-24.
- van Rossum HH, Kemperman H. A method for optimization and validation of moving average as continuous analytical quality control instrument demonstrated for creatinine. Clin Chim Acta 2016;457:1-7.
- van Rossum HH. When internal quality control is insufficient or inefficient: Consider patient-based real-time quality control! Ann Clin Biochem 2020;57(3):198-201.
- Badrick T, Bietenbeck A, Cervinski MA, Katayev A, van Rossum HH, Loh TP. Patient-Based Real-Time Quality Control: Review and Recommendations. Clin Chem 2019;65(8):962-71.