Hemolysis is one of the most common sources of preanalytical error, which could result in falsely decreased or elevated results. It accounts for up to 70% of specimen rejections, which can delay diagnosis and treatment (1). Nowadays, laboratories are often equipped with automated chemistry analyzers that measure serum or plasma HIL (hemolysis, icterus and lipemia) indices. Autoverification rules can be written in the middleware (e.g., Instrument Manager) and automatically flag results with specimen integrity issues, such as when H-indices exceed allowable limits. For most assays, a single hemolysis rejection threshold is usually provided by the manufacturer. For assays which are especially susceptible to hemolysis interference (e.g., aspartate transaminase, AST, and direct bilirubin, DBIL), strictly following the package insert threshold could sometimes cause high specimen rejection rates and repeat specimen rejections for patients. Moreover, it has been reported that hemolysis thresholds may be dependent on the analyte concentrations for some assays, hinting that using a single cutoff could reject specimens unnecessarily (2).
To manage specimen rejection in a smarter way using tailored H-index thresholds, we first need to understand that the patterns of interferographs vary from assay to assay: they can be dependent or independent of analyte concentration, or with complex patterns (3–5). For example, assays which analytes are intracellular components of the erythrocytes (e.g., AST), the false absolute increase in measured analyte concentrations due to hemolysis are independent of the ‘true’ analyte concentrations, while the slopes for the percentage recovery plots are dependent on the analyte concentrations (Figure 1A-B). Therefore, the tolerance for hemolysis for this type of assay increases with the analyte concentration (e.g., an H-index of 100 causes >20% increase for an AST of 40 U/L, but <10% increase for an AST of 140 U/L). Stepwise concentration-dependent thresholds can be designed based on the interferographs and the difference plots (2,4). Note that in-house hemolysis interference studies often use blood from healthy donor(s), and there is inter-individual variation in the concentrations of erythrocyte components (e.g., folic acid). Moreover, some analytes may be present in both erythrocytes and leukocytes (e.g., lactate dehydrogenase, LDH). One should be aware of this when evaluating results from interference studies and when designing H-index thresholds.
Another type of pattern is that the false percentage increase or decrease is independent of the analyte concentration (e.g., high sensitivity troponin T, hs-cTnT) (Figure 1C-D). Tiered hemolysis thresholds can still be designed, in this case by taking into consideration how the results are interpreted clinically. This has successfully reduced specimen rejection rates in at least one large institution (3). Finally, some assays show complex concentration-dependent hemolysis inference patterns, where trends cannot be extrapolated or predicted using the concentration of the analyte (Figure 1E-F). A well-known example is the direct bilirubin diazo method (5). Thresholds can still be carefully designed when multiple concentrations are studied (4).
With the knowledge of how different analytes are impacted by hemolysis, laboratories can design and implement smarter, concentration-dependent, hemolysis rejection thresholds based on total allowable error and clinical significance (using descriptive result comments where necessary). Table 1 provides an example of this concept. For three hemolysis-sensitive assays (AST, LDH and DBIL), our previous institution would have had an average specimen rejection rate of 14.4% for the three assays combined if the manufacturer’s limits were strictly applied. By implementing the abovementioned strategy, we successfully reduced the specimen rejection rate to an average of 3.1% (4).
AUTHOR AFFILIATIONS
1Department of Pathology and Laboratory Medicine, Beaumont Health, Royal Oak, MI, USA; 2Department of Pathology and Laboratory Medicine, Oakland University William Beaumont School of Medicine, Auburn Hills, MI, USA; 3Medical and Scientific Affairs, Beckman Coulter, Brea, CA, USA
FIGURE LEGEND
Figure 1 A, C, and E: Interferographs for AST, hs-cTnT, and DBIL, respectively. B, D and F: Difference plots for AST, hs-cTnT, and DBIL, respectively. AST and DBIL assays were performed on the Roche cobas c702 module and data was from Tang et al.4. The hs-cTnT (cTnT Gen 5) assay was performed on the Roche cobas e602 module and data was from Tang et al.6.
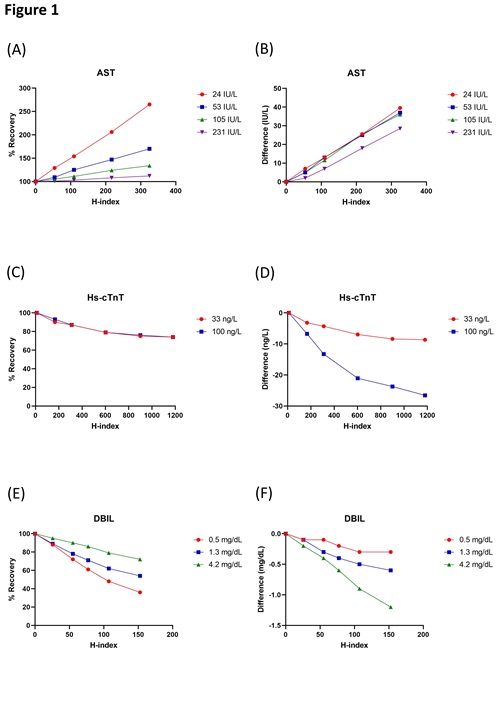
Table 1. Example of concentration-dependent hemolysis thresholds.
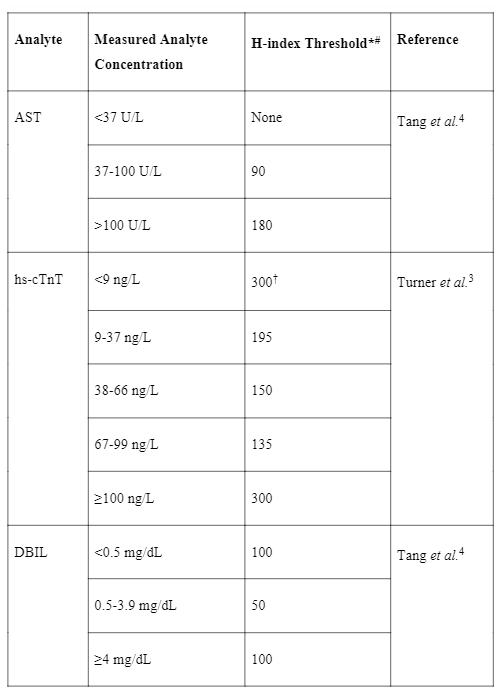
#The H-index is approximately equal to the hemoglobin concentration in mg/dL. *Results are released with interpretative comments above certain H-indices, please refer to source reference for more information. †Note that these thresholds are tailored to clinically significant changes based on the specific ‘0-2h algorithm’ used in that institution.
REFERENCES
- Lippi G, Blanckaert N, Bonini P, Green S, Kitchen S, Palicka V, et al. Haemolysis: an overview of the leading cause of unsuitable specimens in clinical laboratories. Clin Chem Lab Med. 2008;46:764–72.
- Knezevic CE, Ness MA, Tsang PHT, Tenney BJ, Marzinke MA. Establishing hemolysis and lipemia acceptance thresholds for clinical chemistry tests. Clin Chim Acta. 2020;510:459–65.
- Turner KA, Kaleta EJ, Harnish TL, Madani Z, Snozek CLH. Evaluating Tiered Hemolysis Thresholds to Facilitate Rapid Reporting of High-Sensitivity Cardiac Troponin. Jrnl App Lab Med. 2019;4:193–200.
- Tang NY, Mitchell KR, Groboske SE, Baldwin AD, Lenza M, Yeo K-TJ, et al. Reducing Specimen Rejection Rates Using Concentration-Dependent Hemolysis Rejection Thresholds. The Journal of Applied Laboratory Medicine. 2023;jfac095.
- Webster RA, Molnar P, Kahn SE. Comparative interference by haemolysis in automated assays for bilirubin at multiple analyte concentrations. Journal of Analytical Methods in Chemistry. Hindawi; 1989;11:254–9.
- Tang NY, van Wijk XM. (2020) High-sensitive cardiac troponin T: the issue of hemolysis interference. Clinical laboratory International. 2020;Feb/March:18–9