Summary
DOI: 10.1373/clinchem.2018.297176
A 78-year-old woman was referred to our hospital for further investigation of a bicytopenia.
Student Discussion
Student Discussion Document (pdf)
Matthieu C.J. Bosman,1 Rachel H.P. Schreurs,2 Laurens Nieuwenhuizen,2 Dirk L. Bakkeren,1 and
Joannes F.M. Jacobs3*
1Laboratory for Clinical Chemistry and Hematology, Máxima Medical Center, Veldhoven, the Netherlands; 2Department of Internal Medicine, Máxima Medical Center, Veldhoven, the Netherlands; 3Department of Laboratory Medicine, Radboud University Medical Center, Radboud Institute for Molecular Life Sciences, Nijmegen, the
Netherlands.
*Address correspondence to this author at: Department of Laboratory Medicine, Laboratory Medical Immunology (route 469), Radboud University Medical Center, Geert Grooteplein 10, 6525 GA Nijmegen, the Netherlands. Fax +31-(0)24 –3619415; e-mail [email protected]
Case Description
A 78-year-old woman was referred to our hospital for further investigation of a bicytopenia. She had a history of rheumatoid arthritis and Sjögren syndrome for which she was treated with methotrexate and etanercept. She had no complaints, and during physical examination, no lymphadenopathy, masses, or visceromegaly was found. Hematologic evaluation showed the following results: hemoglobin, 9.7 g/dL (reference, 12.1–16.1 g/dL); white blood cells, 1.6 X 10⁹/L (reference, 4.0 –10.0 X 10⁹/L); and thrombocytes, 156 X 109/L (reference 150–400 X 109/L). A peripheral blood smear did not show blasts or
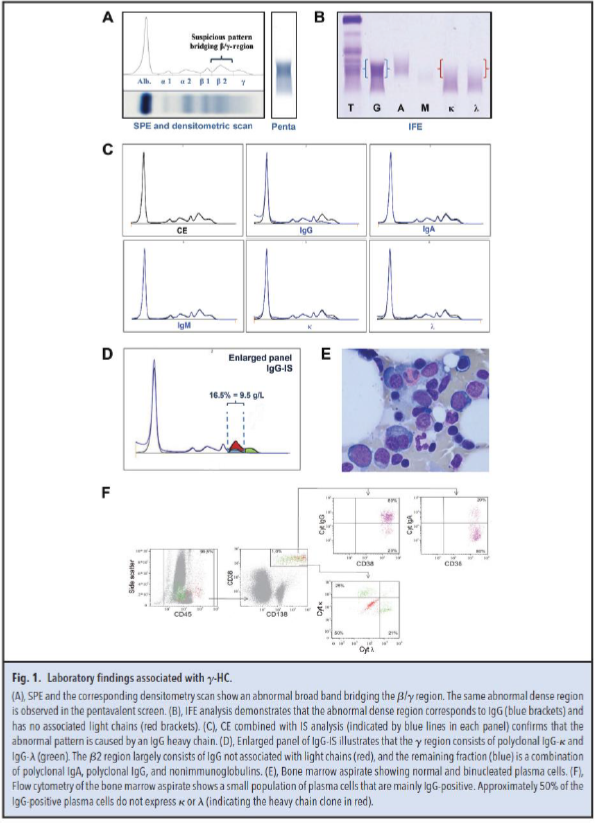
dysplastic features of the white blood cells. The patient had normal ferritin, vitamin B12, and folic acid concentrations without evidence of hemolysis. Serum protein electrophoresis (SPE) and immunofixation electrophoresis (IFE) with pentavalent antiserum were performed as M-protein screening. Both techniques demonstrated a broad band in the β/γ region (Fig. 1A). Further IFE analysis, shown in Fig. 1B, identified the abnormal pattern as a broad IgG band (blue brackets) with no corresponding light chain band (red brackets). These data suggested the presence of an IgG heavy chain M protein (γ-HC).
Capillary electrophoresis (CE) combined with immunosubtraction (IS) analysis (Fig. 1C) confirmed that the abnormal pattern was caused by a γ-HC. IgG-IS (Fig. 1D) illustrated that the γ region consisted of polyclonal IgG-κ and IgG-λ (green). The β2 region largely consisted of IgG not associated with light chains (γ-HC, represented in red), and the remaining fraction (blue) was a combination of polyclonal IgA, polyclonal IgG, and nonimmunoglobulins.
The serum Hevylite immunoassay has been recommended both for confirmation and quantification of a
monoclonal heavy chain (1). The Hevylite reagents specifically target the unique junctional epitope between the immunoglobulin heavy chain and light chain combination. An (IgGκ + IgGλ)/IgGtotal ratio lower than 0.8 is indicative of the presence of a γ-HC (1). In our patient, the ratio was 0.6 (IgGtotal = 15.6 g/L, IgGκ = 4.4 g/L, and IgGλ = 4.9 g/L). Furthermore, the γ-HC concentration could be estimated as follows: [γ-HC] = [IgGtotal] - [IgGκ] - [IgGλ]. The γ-HC concentration in our patient measured using the Hevylite reagents was 6.2 g/L. This corresponds to the γ-HC concentration determined from the CE pattern and total serum protein concentration (β2 region is 16.5% of 58 g/L = 9.5 g/L). From Fig. 1D, it is estimated that approximately two-thirds of the β2 region comprises the γ-HC (two-thirds of 9.5 = 6.3 g/L).
Bone marrow analysis showed the presence of approximately 2% plasma cells, of which about 30% were
atypical or binucleated (Fig. 1E). No other abnormalities were observed within the bone marrow. Using
flow cytometry, a small population of plasma cells was detected. Eighty percent of these plasma cells
expressed cytoplasmic IgG, and 50% of the cells did not express either cytoplasmic κ or λ (Fig. 1F).
Interestingly, these κ/λ- negative cells expressed multiple aberrant markers
(CD45highCD138highCD20+CD56+). All together, we observed a low percentage (approximately 1%) of
malignant plasma cells expressing a γ-HC.
Reference
- Kaleta E, Kyle R, Clark R, Katzmann J. Analysis of patients with γ-heavy chain disease by the heavy/light chain and free light chain assays. Clin Chem Lab Med 2014;52:665–9.
Questions to Consider
- Which electrophoretic features are unique for a heavy chain protein?
- What alternative methods can be used to confirm the presence of a heavy chain protein?
- Would your diagnostic laboratory be able to recognize a heavy chain?
Final Publication and Comments
The final published version with discussion and comments from the experts appears
in the May 2019 issue of Clinical Chemistry, approximately 3-4 weeks after the Student Discussion is posted.
Educational Centers
If you are associated with an educational center and would like to receive the cases and
questions 3-4 weeks in advance of publication, please email [email protected].
AACC is pleased to allow free reproduction and distribution of this Clinical Case
Study for personal or classroom discussion use. When photocopying, please make sure
the DOI and copyright notice appear on each copy.
DOI: 10.1373/clinchem.2018.297176
Copyright © 2019 American Association for Clinical Chemistry