Summary
DOI: 10.1373/clinchem.2018.299008
A 71-year-old man presented with increasing confusion after dialysis.
Student Discussion
Student Discussion Document (pdf)
Angela W.S. Fung,1*† Mindy C. Kohlhagen,2 Mari L. DeMarco,1† and John R. Mills2
1Department of Pathology and Laboratory Medicine, St. Paul’s Hospital, Providence Health Care and University of British Columbia, Vancouver, BC, Canada; 2Department of Laboratory Medicine and Pathology, Mayo Clinic, Rochester, MN, USA.
*Address correspondence to this author at: Department of Pathology and Laboratory Medicine, St. Paul’s Hospital, Providence Health Care, 1081 Burrard St., Vancouver, BC, Canada V6Z 1Y6. Fax +604-806-9681; e-mail [email protected]
Case Description
A 71-year-old man presented with increasing confusion after dialysis. He was admitted for progressive decline in functional status over a 1-month period including delirium, a fall, and difficulty with pain, speaking, and walking. Four years ago, he was diagnosed with stage IIIB multiple myeloma with IgAκ M-protein and corresponding κ free light chain (FLC). He was treated with combination
chemotherapy of cyclophosphamide, bortezomib, and dexamethasone, and he achieved partial remission. Medical history was significant for myeloma-related end-stage renal failure, hypertension, osteonecrosis of the jaw secondary to bisphosphonate, and recent onset of squamous cell carcinoma.
At presentation, physical examination was unremarkable. The patient was alert and oriented, with a Glasgow coma scale of 15. Laboratory findings included hemoglobin concentration of 10.4 g/dL [reference interval (RI), 13.5–17.0 g/dL] and mean red cell volume of 114 fL (RI, 82–98 fL). Additional test results included a plasma total protein concentration of 6.5 g/dL (RI, 6.0–8.0 g/dL), albumin concentration of 4.2 g/dL (RI, 3.5–4.8 g/dL), total calcium concentration of 12.4 mg/dL (RI, 8.7–10.3 mg/dL; 3.11 mmol/L; RI, 2.18 –2.58 mmol/L), ionized calcium concentration of 6.12 mg/dL (RI, 4.68 –5.16 mg/dL; 1.53 mmol/L; RI, 1.17–1.29 mmol/L), phosphorus concentration of 7.3 mg/dL (RI, 2.5–5.0 mg/dL; 2.36 mmol/L; RI, 0.80 –1.60 mmol/L), alkaline phosphatase concentration of 75 U/L (RI, 30–105 U/L), creatinine concentration of 10.2 mg/dL (RI, 0.68 –1.13 mg/dL; 903 μmol/L; RI, 60–100 μmol/L), and blood urea nitrogen concentration of 69 mg/dL (RI,7–22 mg/dL; 24.6 mmol/L; RI, 2.5– 8.0 mmol/L).
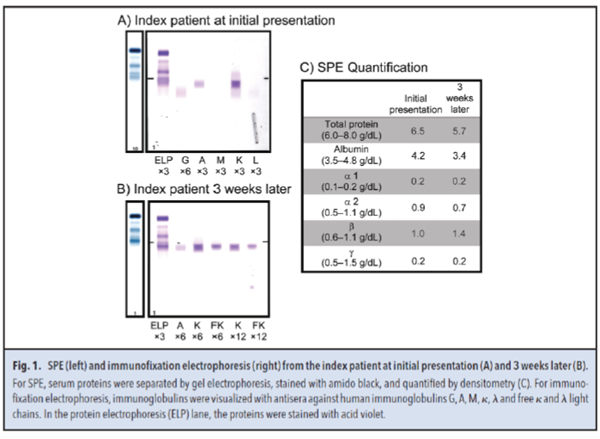
Serum protein electrophoresis (SPE) (Fig. 1, A and C) showed hypogammaglobulinemia, with a β region of 1.0 g/dL. Immunofixation electrophoresis identified the presence of IgAκ M-protein in the β region. Serum κ and λ FLCs concentrations were 4490.00 mg/dL (RI, 0.33–1.94 mg/dL) and 1.12 mg/dL (RI, 0.57–2.63 mg/dL), respectively, with a κ/λ FLC ratio of 4009.00 (RI, 0.26 –1.65).
Three weeks later, a second SPE (Fig. 1, B and C) showed hypogammaglobulinemia but with an increased β region of 1.4 g/dL. In the β region, immunofixation electrophoresis identified an IgAκ M-protein along with a κ FLC band. The plasma total protein and albumin concentrations were 5.7 g/dL and 3.4 g/dL, respectively. Serum κ and λ FLC concentrations were 7830.00 mg/dL and 0.99 mg/dL, respectively, with a κ/λ FLC ratio of 7909.00. No urine specimens were submitted. Of note, the κ FLC and total protein concentrations were highly discordant, with the κ FLC concentration (7830.00 mg/dL or 7.83 g/dL) exceeding the total protein concentration (5.7 g/dL).
Questions to Consider
- What are causes of discordance between total protein and serum FLC quantification?
- What are limitations of serum FLC assays?
- What strategies can be used to clarify suspected inaccurate FLC results?
Final Publication and Comments
The final published version with discussion and comments from the experts appears
in the September 2019 issue of Clinical Chemistry, approximately 3-4 weeks after the Student Discussion is posted.
Educational Centers
If you are associated with an educational center and would like to receive the cases and
questions 3-4 weeks in advance of publication, please email [email protected].
AACC is pleased to allow free reproduction and distribution of this Clinical Case
Study for personal or classroom discussion use. When photocopying, please make sure
the DOI and copyright notice appear on each copy.
DOI: 10.1373/clinchem.2018.299008
Copyright © 2019 American Association for Clinical Chemistry