Patient blood management (PBM) is a multimodality, multidisciplinary approach to stewardship in transfusion medicine. It involves optimization of anemia and hemostasis with a goal of avoiding unnecessary transfusions. Now considered standard of care, PBM is patient-centered and can improve quality while reducing costs. The recent intermittent national blood shortages make PBM more important than ever (1).
One effective approach to curb unnecessary blood transfusions is clinical decision support (CDS) (2). Multiple large, randomized controlled trials support a restrictive hemoglobin threshold for red blood cell (RBC) transfusion. Many different individuals within a hospital system have privileges to decide whether to give or withhold a transfusion. In tandem with appropriate education efforts, CDS can influence their transfusion decisions based on the best available evidence and reduce over-transfusion events (2).
CDS, however, does not sufficiently address all PBM practices by itself. For example, a patient scheduled for a complex cardiothoracic (CT) surgery procedure 3 weeks from now may ultimately require multiple RBC transfusions intraoperatively. For that same patient, a proactive approach to PBM could result in zero RBC transfusions. Treating iron deficiency anemia before surgery, using cell salvage, and antifibrinolytic agents together could obviate the need for any transfusion, and the differential blood utilization between these two examples can occur despite the use of appropriate transfusion thresholds.
As a transfusion medicine specialist interested in data-driven PBM and a data visualization expert, we wanted to evaluate PBM practices more holistically. For example, when comparing blood utilization among surgeons within a department, surgeons with higher average blood use per case may justifiably feel the comparisons are not fair because they operate on the most complex patients, who are more likely to bleed. For fairer comparisons, we developed a risk-adjusted benchmarking method using diagnosis-related group (DRG) billing code weights that modeled the association between patient complexity (DRG weight) and blood utilization (3).
Sharpening Understanding With Data Visualization
Although the benchmarking method added useful context, we realized this concept could be taken much further. To create more meaningful comparisons, we turned our attention to advanced data visualization in a complex patient population: CT surgery. Data visualization involves graphical representations of data to facilitate understanding and insights. Our goal with advanced data visualization was to create a new approach to visualizing PBM practices that is rapid, flexible, in-context, and tied to patient outcomes. What if we could build such a tool and have potential end users help with the design? Give the people what they want.
While we had several ideas for what a novel data visualization tool might look like, we took a unique approach to glean insights into perspectives of other potential end users: surgeons and anesthesiologists. We held a 3-hour creative visualization opportunities (CVO) workshop facilitated by our data visualization expert and PBM expert (4). This involved an introduction to PBM and discussion of current workflows, followed by creativity techniques, such as “wishful thinking” and “visualization analogies,” that challenged participants to think big about what might be useful if anything were possible. We also shared prior visualization tools that had nothing to do with medicine (e.g., visualizing characteristics of the best soccer players in the world). We concluded the session with barrier removal and reflection on the workshop.
Several themes emerged that helped guide our iterative development of the data visualization tool. All participants wanted data on how their practice compared to a standard, benchmarking utilization with risk adjustment, information at hierarchical levels, and specific patient outcomes. A big concern was that transfusion can feel like an emotional decision, especially when patients are coming off bypass in CT surgery, and the bias is to transfuse if unsure. The CVO workshop created an environment of psychological safety for these end users to share thoughts they may have otherwise kept to themselves.
Subsequently, our core research team met weekly and communicated frequently to develop and refine our data visualization tool prototype, which we call Sanguine (5). With Sanguine we can evaluate preoperative anemia management, transfusion appropriateness, use of antifibrinolytic agents, use of cell salvage, costs, and more (Figure 1). Each of these can be viewed at any hierarchical level of interest (e.g., by surgeons, anesthesiologists, individual patients, etc.) or quickly filtered to provide clinical context (e.g., PBM modality, procedure type, patient outcome, etc.). The rapid flexibility to create any useful visualization is unique in transfusion medicine and PBM.
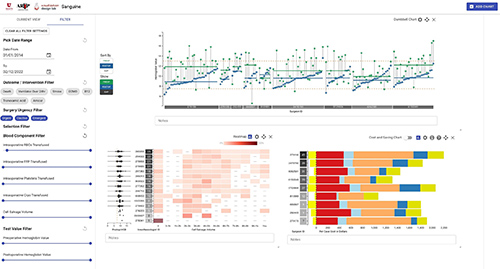
Figure 1: Example Patient Blood Management Data Visualizations in Cardiothoracic Surgery
This figure shows multiple visualizations filtered to focus on coronary artery bypass graft procedures. The left panel shows elective, urgent, and emergent case types are all included and the blood component filter was used to exclude cases that had zero intraoperative red blood cell (RBC) transfusions. Three visualizations are presented here. The top shows a dumbbell chart with postoperative hemoglobin levels (y-axis, blue dots) by surgeon (x-axis) that can be used to identify over-transfusion when hemoglobin values are well above the post-transfusion target of ~8.5 g/dL. The bottom left shows a heatmap of cell salvage use in ml (x-axis) by anesthesiologist (y-axis). Because we filtered to include cases with at least one allogeneic RBC transfusion, 0ml of cell salvage could indicate underutilization of this PBM technique. On the bottom right, one can visualize the variation in cost of all transfusions and by blood component (e.g. RBCs) using this stacked bar chart. We also show potential cost savings using cell salvage and all costs are readily customizable to the end user institution’s costs, if needed, by clicking the “$” sign.
Translating Insights Into Better Patient Care
Another use case for Sanguine is called “patients like mine” (PLM). This term was coined by researchers at Stanford and uses data from past patients with similar characteristics to an upcoming patient (6). For example, it can be useful to know how much blood an upcoming complex CT surgical case might use (Figure 2). We've used this PLM approach numerous times during the pandemic to stay prepared and meet patient needs.
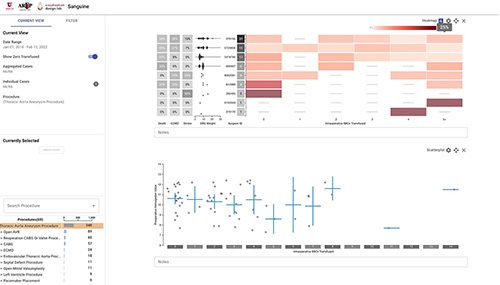
Figure 2: Example “Patients Like Mine” Visualization
This figure shows thoracic aortic aneurysm procedure cases filtered to a specific preoperative hemoglobin range to better represent a patient with preoperative anemia, a risk factor for greater number of transfusions. We first created the heatmap on the top, with intraoperative RBCs transfused (x-axis) by surgeon (y-axis). We then added a scatterplot down below with intraoperative RBCs transfused (x-axis) by preoperative hemoglobin (y-axis). Next, we brushed over a specific preoperative hemoglobin range to filter out patients with a normal preoperative hemoglobin. This can be useful if your upcoming patient has anemia preoperatively. This interacted with the top chart to filter the heatmap to only include cases selected on the scatterplot. We then added more clinical context in the form of risk adjustment (DRG weight), in-hospital mortality, risk of needing extracorporeal membrane oxygenation (ECMO), and stroke. This can inform end users about risk of an upcoming patient with similar features to past patients seen by the same surgeon both from a blood ordering and patient outcomes standpoint. This example also illustrates the unique ability of Sanguine to create clinical context in benchmarking.
We are currently in the early deployment phase of the Sanguine prototype at our institution, but feedback from anesthesiologists and surgeons has been enthusiastic. Sanguine is available as an open-source tool at github.com/visdesignlab/Sanguine.
Next steps include collaboration with outside institution beta sites as well as adding surgeon and anesthesiologist names to the tool. Previous studies have shown that including names can motivate behavior change (7). Our colleagues have also expressed interested in knowing where they stand.
Lastly, blood utilization is probably a useful surrogate marker for quality in high blood loss surgeries. This, combined with the fact that we designed Sanguine with other end users in mind, means that Sanguine can be used as an advanced quality tool to evaluate surgical practices. We incorporated outcomes known to be important to surgeons and anesthesiologists, such as mortality, risk of needing extracorporeal membrane oxygenation, stroke, prolonged ventilation, intensive care unit length of stay, and more. Our surgeon and anesthesiologist colleagues have told us that Sanguine provides information and insights that do not currently exist from their national benchmarking organizations.
While not our original intent, it has become apparent that Sanguine provides a glimpse into practice quality beyond PBM that, to our knowledge, does not currently exist. We have observed significant practice variation, and whether Sanguine would be universally well received in this regard by some potential end users remains to be seen. For example, will increased transparency potentially cause surgeons concern? This is possible. If the goal is to provide a next generation benchmarking tool to best serve patients, then transparency at this level may be inevitable. The question may not be whether such a tool should exist, but how institutions can use it to provide the most benefit, carefully and constructively.;
References
- Shander A, Goobie SM, Warner MA, Aapro M, Bisbe E, Perez-Calatayud AA, et al. Essential Role of Patient Blood Management in a Pandemic: A Call for Action. Anesth Analg 2020;131:74–85.
- Hibbs SP, Nielsen ND, Brunskill S, Doree C, Yazer MH, Kaufman RM, et al. The Impact of Electronic Decision Support on Transfusion Practice: A Systematic Review. Transfus Med Rev 2015;29:14–23.
- Metcalf RA, White SK, Potter S, Barney R, Hunter C, White M, et al. The association of inpatient blood utilization and diagnosis-related group weight: implications for risk-adjusted benchmarking Transfusion (Paris) 2019;59:2316–23.
- A Framework for Creative Visualization-Opportunities Workshops [Internet]. [cited 2022 Feb 11]. Available from: https://vdl.sci.utah.edu/publications/2018_infovis_creative-workshops/
- Lin H, Metcalf RA, Wilburn J, Lex A. Sanguine: Visual analysis for patient blood management. Inf Vis SAGE Publications 2021;20:123–37.
- Gombar S, Callahan A, Califf R, Harrington R, Shah NH. It is time to learn from patients like mine. Npj Digit Med Nature Publishing Group 2019;2:1–3.
- Frank SM, Savage WJ, Rothschild JA, Rivers RJ, Ness PM, Paul SL, et al. Variability in blood and blood component utilization as assessed by an anesthesia information management system. Anesthesiology 2012;117:99–106.
Ryan A. Metcalf, MD, CQA(ASQ), is a section chief of transfusion medicine and medical director of transfusion/blood bank at ARUP Laboratories and associate professor (clinical) in the department of pathology at the University of Utah, Salt Lake City. +Email: [email protected]
Alexander Lex, PhD, is an associate professor at the Scientific Computing and Imaging Institute in the School of Computing at the University of Utah in Salt Lake City. +Email: [email protected]