Liquid chromatography-tandem mass spectrometry (LC-MS/MS) is not a panacea for inaccurate patient testing. While few laboratorians would disagree with this statement, many of us fall into the trap of thinking that LC-MS/MS results are inherently more reliable than those obtained by immunoassays. In reality, LC-MS/MS offers a range of sophisticated options for detecting and resolving potentially inaccurate results. This opportunity comes in large part from the wealth of analytical metadata—ion ratios, internal standard recoveries, and other quality assessment data—available for each patient result.
Are clinical laboratories using this metadata in their quality assurance (QA) programs? If so, which aspects of metadata do they utilize, and what alert mechanisms do they employ to warn of potentially erroneous results? These were the questions we sought to answer through a web-based survey that asked clinical laboratories worldwide what QA metrics they apply to 25-hydroxy vitamin D LC-MS/MS results.
A total of 50 respondents answered the survey, and the results yielded insight into how clinical laboratories are using LC-MS/MS metadata in their QA programs.
How Do Laboratories Define Acceptable Internal Standard Recovery?
Commonly used ionization strategies for LC-MS/MS assays are susceptible to ionization suppression and ionization enhancement, or matrix effect. This variability in ionization can lead to disproportional ion counts within individual samples compared with the average ion counts of the calibrators, resulting in quantification errors (1).
Including co-eluting internal standards helps to mitigate the inaccuracies introduced by these matrix effects. In addition, internal standards help normalize against differential losses that occur during the often multistep procedures used for sample preparation. Finally, monitoring the recovery of internal standards identifies signal variance caused by mis-injection of extracted sample by the LC-MS/MS instrumentation.
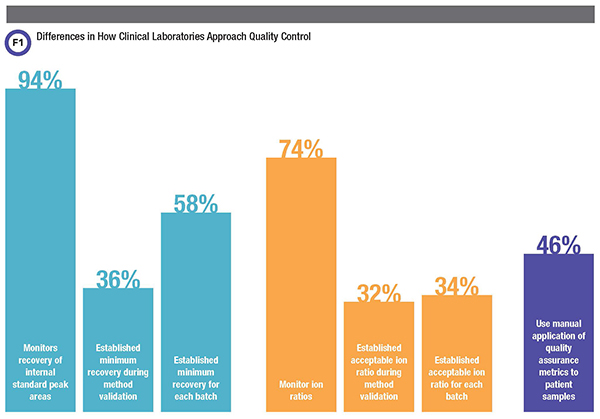
Perhaps not surprisingly then, most but not all laboratories (94%) reported monitoring recovery of internal standard peak areas. Respondents’ strategies and criteria for assessing internal standard recovery, though, varied substantially.
Labs calculate internal standard recoveries by dividing the internal standard peak area for each patient sample by some defined reference internal standard peak area. This defined reference internal standard peak area can be a static value determined during method validation, an approach 36% of laboratories reported taking. In contrast, 58% of laboratories reported calculating the defined reference internal standard peak area for each batch using the average of internal standard peak areas of calibrators and/or quality control and/or patient samples.
Defining acceptability criteria by batch is less stringent, allowing for typical batch-to-batch variations in internal standard recovery that may have no effect on quantitation. However, a simple batch-to-batch strategy would not identify systemic issues that develop over time and might negatively impact method performance.
Our survey found further differences among laboratories about what they considered acceptable variations in the internal standard recovery areas. Most laboratories set acceptable variation using a fixed percent recovery, which ranged from 10% to 200% of their defined reference. Others used standard deviations derived from the defined reference (22%). While internal standards effectively normalize results to compensate for matrix effects and process variance, laboratories must be careful, as excessively low recovery of the internal standard can lead to unreliable quantitation (2).
A survey of 50 clinical laboratories found some significant differences in how they employ different quality metrics for 25-hydroxy vitamin D liquid chromatography-tandem mass spectrometry testing.
Furthermore, researchers have described differences between matrix effect for an analyte and its co-eluting internal standard (5). This phenomenon indicates that merely including an internal standard for each analyte is no substitute for robust method development and method validation.
How Many Ion Ratios Are Monitored and What Are the Acceptability Criteria?
While not necessary for quantitation, LC-MS/MS allows for the acquisition of multiple transitions for each analyte and calculation of ion ratios. To calculate an ion ratio, laboratorians divide the peak area of one transition by the peak area of a second transition.
By convention, the less intense transition, often called the qualifier, is typically the numerator while the more intense transition, the quantifier, is the denominator. If the ion ratio obtained from a patient sample differs substantially from the expected ratio, an interference may be present.
Use of ion ratios has been shown to reduce the likelihood of reporting inaccurate results due to interferences (3). However, 26% of laboratories in our survey reported that they do not monitor ion ratios. It should be noted that many respondents reported using a derivatization approach that precluded inclusion of a second transition in the method.
Within the majority of laboratories that did report monitoring ion ratios, there was substantial heterogeneity around both how they determined the expected ratio and how they defined acceptable deviation from this ratio. Among our respondents, 32% reported defining the expected ion ratios during method validation, while 34% said they do so for each batch of patient samples. Labs have several options for defining this ratio—analyzing calibrators, quality control samples, patient samples, or any combination of the preceding—and our respondents indicated that they use multiple combinations. Within this range of possibilities, the most popular in our survey was the combination of calibrators and quality control samples.
At a more granular level, what laboratories defined as an acceptable variation from the expected ratio ranged greatly. Most respondents cited 20% but others reported variations as low as 10% to as high as 40%.
LC-MS/MS metadata tell us a great deal about the accuracy of patient results if this data is used as part of a well-defined QA program. Using metadata in this way requires both clear knowledge of which metrics should be monitored and how metric acceptability criteria should be defined. It also requires the tools to apply the metrics and acceptability criteria to each patient sample result during production.
The heterogeneity noted in this survey suggests that clinical laboratories need additional, more granular guidance on which metrics they should monitor and how they should define acceptability criteria. Furthermore, many laboratories noted challenges in knowing what corrective actions to take when certain metrics failed. For example, if the internal standard recoveries are consistently low even on re-injection of an extracted sample, what is the appropriate course of action? Certainly laboratories would welcome guidance based on clinical laboratory production experience that deals with these questions.
As for applying these metrics, respondents consistently identified limitations in vendor-provided software as a challenge to using metadata as a QA metric in routine practice. Consistent with this observation, almost half (46%) of respondents reported relying on manual application of QA metrics to patient samples. The vast quantity of metadata available, in addition to the high volumes of patient samples that laboratories are typically processing, requires sophisticated automation approaches for applying metrics and acceptability criteria. While this survey focused on 25-hydroxy vitamin D, more than half our respondents stated that the QA practices they described were similar for other methods implemented in their laboratories. This suggests that the lack of standardization observed here for applying metadata is endemic in clinical LC-MS/MS assays.
A previous CLN article observed a similar outcome using queries of a large database (4). Closing the gap with additional best practice guidance, better software applications, and more sophisticated regulation seems a worthwhile goal for clinical MS.
Joshua Hayden, PhD, DABCC, FADLM, is chief of chemistry at Norton Healthcare in Louisville, Kentucky. +Email: joshua.hayden@nortonhealthcare.org
Lorin Bachmann, PhD, DABCC, FADLM, is an associate professor of pathology, co-director of clinical chemistry, and co-director of point-of-care testing at Virginia Commonwealth University Health in Richmond, Va. +Email: [email protected]
References
- George R, Haywood A, Khan S, et al. Enhancement and suppression of ionization in drug analysis using HPLC-MS/MS in support of therapeutic drug monitoring: a review of current knowledge of its minimization and assessment. Ther Drug Monit 2018;40:1-8.
- Danese E, Salvagno GL, Guzzo A, et al. Urinary free cortisol assessment by liquid chromatography tandem mass spectrometry: A case study of ion suppression due to unacquainted administration of piperacillin. Biochem Med 2017;27:031001.
- Schneir A, Metushi IG, Sloane C, et al. Near death from a novel synthetic opioid labeled U-47700: Emergence of a new opioid class. Clin Toxicol 2017;55:51-4.
- Zabell A, Stone J, Julian RK. Using big data for LC-MS/MS quality analysis. Clinical Laboratory News 2017;43(5):30-1.
- Lindegardh N, Annerberg A, White NJ, et al. Development and validation of a liquid chromatographic-tandem mass spectrometric method for determination of piperaquine in plasma stable isotope labeled internal standard does not always compensate for matrix effects. J Chromatogr B Analyt Technol Biomed Life Sci 2008;862:227-36.