 Coagulation testing, especially the global coagulation test prothrombin time (PT), is not exactly an ideal laboratory test. I say this because PT does not evaluate a well-defined analyte with results reflected as a concentration of that analyte. Rather, PT assesses the interaction of more than a dozen different enzymes within a blood sample, and a PT test result reflects a clotting time measured at a different end point for each instrument used.
In addition, the reagent for the PT test, thromboplastin, is not standardized. The original thromboplastin reagents were crude preparations from multiple tissue types from several different species. Today, thromboplastins may consist of recombinant rabbit or human brain protein complexed with phospholipids. There is limited standardization, achieved through use of the international normalized ratio (INR), for patients on long-term oral anticoagulant therapy with vitamin K antagonists such as warfarin and coumarin. Calculation of INR from PT clotting time follows the formula:
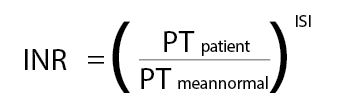
Each thromboplastin manufacturer assigns its reagent an international sensitivity index (ISI) that is traceable to a World Health Organization (WHO) international reference thromboplastin (IRP). As the ISI of the reagent also is dependent on the instrumentation used, the thromboplastin manufacturers provide ISI values for specific thromboplastin/instrument combinations. Individual laboratories can determine their local mean normal PT and verify the ISI for their local system following procedures described in CLSI H47, “One Stage Prothrombin Time (PT) Test and Activated Partial Thromboplastin Time (APTT) Test.”
Use of the INR moves the PT test a bit closer to an ideal laboratory assay, but we still observe clinically important discrepancies of INR. CLSI POCT14 (formerly H49), “Point-of-Care Monitoring of Anticoagulation Therapy,” describes multiple studies in which extensive INR variability has been reported for different laboratory and point-of-care (POC)-PT systems. It states that the likelihood of observing clinically important system differences increases as the INR rises above 3.0. In addition, when looking at repeated measurements, results that differ by up to +0.4 INR at a target of 2.5 INR and by up to +0.7 INR at a target of 3.5 INR are statistically equivalent. These data are true whether comparisons are made between laboratory systems or between POC and laboratory tests.
POC devices introduce additional challenges to INR standardization. Manufacturers determine the ISI and mean normal PT, and these values cannot be adjusted. The ISI assignment, like that for laboratory analyzer reagents, is accomplished through the use of either primary or secondary standards referenced to the WHO thromboplastin. Each system has its own proprietary method to calculate and report the PT seconds and INR based on the signal produced.
While laboratory analyzers use either an optical or mechanical means to detect a fibrin endpoint, POC analyzers employ a wider range of technologies. These include optical detection, monitoring the movement of magnetic particles, impedance measurements, and measurement of current produced by electroactive thrombin substrates.
Sample type also contributes to variation between lab and POC devices. POC systems employ non-anticoagulated whole blood immediately applied to the device and tested. In contrast, laboratories receive citrated whole blood samples that are processed to obtain plasma which then is tested on the lab analyzer.
With a clear understanding of this lack of true standardization, what can a laboratory do to ensure that use of a POC PT/INR system will not adversely impact patient care?
When labs implement these systems, the required comparative data analysis for accuracy must include traditional correlation analysis, mean versus difference plots, and assessment of the incidence of clinically important INR differences. Optimally, during this comparison patient samples spanning the POC system reportable range will be evaluated. In reality, however, during the analysis of data from a well-controlled oral anticoagulation patient population, it is difficult to acquire a reasonable number of samples with high INRs exceeding 4.0 to perform a good statistical analysis. Rather than delay implementation of POC PT/INR, many facilities evaluate the data collected and identify the maximum INR that the data suggest is accurate; commonly between 3.5 and 5.0 INR. End users are then trained to send a sample to the laboratory for PT/INR testing if the POC result exceeds this value. Over time, the collation of data from these samples will allow an extension of the allowed reportable range of the POC analyzer.
Evidence-based medicine guidelines recommend use of POC PT/INR systems for monitoring oral anticoagulation therapy. POC can improve patient and clinician satisfaction as well as the patient’s time in therapeutic range. Labs can mitigate the variability of INR monitoring systems by consistently using a single test system to manage an individual patient.
President of ZIVD, Marcia Zucker, PhD, is an independent consultant specializing in all aspects of point-of-care diagnostics. She chairs AACC’s Critical and Point of Care Testing Division and is a member of the CLSI Consensus Committee for Point-of-Care Testing.
+Email: [email protected]