
Today clinical laboratories have come under increased pressure to implement quality systems and new risk management guidelines for quality control in order to ensure timely and accurate delivery of test results. However, one issue that is often overlooked in these efforts is the actual quality goal or requirement for a laboratory test. In simple terms, the question that laboratory professionals should be asking is: how good does a test need to be? As laboratories attempt to answer this basic question, other questions quickly become evident—how should the laboratory define the quality goal? how should the laboratory validate the analytical methods to satisfy the goal? and what is the best way for the laboratory to assure those goals are achieved in routine testing?
An effective system for managing analytical quality can be developed based on the concept of total analytic error (TAE), a useful metric both to assess laboratory assay quality and to set quality goals for assays. Other tools, such as Sigma metrics, method decision charts, Sigma statistical quality control (SQC) selection graphs, and charts of operating specifications are also useful. In this article, we review the concept of TAE, including its estimation and application in managing the analytical quality of laboratory testing processes.
The Basic Concept
In 1974, Westgard, Carey, and Wold introduced the concept of TAE in an effort to provide a more quantitative approach for judging the acceptability of method performance (1). At that time, the practice used by laboratories considered precision (imprecision) and accuracy (inaccuracy, bias) as separate sources of errors and evaluated their acceptability individually.
This practice originated in conventional analytic laboratories in which replicate measurements were usually made to reduce the effects of imprecision, which left bias as the primary consideration for assessing the quality of a test result. As we know, however, clinical laboratories typically make only a single measurement on each patient specimen. Therefore, the analytical quality of a test result depends on the overall or total effect of a method’s precision and accuracy.
This difference in clinical laboratory practice prompted introduction of the TAE concept. In short, the authors recommended that the acceptability of method performance be judged on the sizes of the observed errors relative to a defined allowable total error (ATE). Because terminology and abbreviations sometime complicate discussions of this concept and because the Food and Drug Administration (FDA) favors TAE and ATE, these terms will be used in the rest of this discussion. Furthermore, these abbreviations will likely become part of the standard lexicon in clinical laboratories.
Estimating Total Analytic Error
In order to put the concept into practice, the authors recommended that laboratories estimate TAE by combining the estimate of bias from a method comparison study and the estimate of precision from a replication study. Accordingly, using a multiple of the standard deviation (SD) or coefficient of variation (CV), TAE = bias + 2 SD (orTAE = bias + 1.65 SD for a one-sided estimate) for a 95% confidence interval or limit of the possible analytic error (Figure 1).
Figure 1
Total Analytic Error Concept
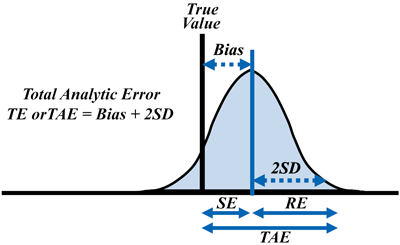 The graph shows a representation of total analytic error or total error using the terminology of the original paper: random error (RE), systematic error (SE), total analytic error (TAE or TE), bias (inaccuracy), and SD (standard deviation).
After Westgard, Carey, and Wold proposed these definitions, some analysts argued that there were additional components of error that should be considered, such as interferences that affect individual patient samples, sometimes referred to as random biases. To include such effects, Krouwer recommended a direct estimation of TAE obtained by using a comparison with a reference method (2), and the Clinical Laboratory Standards Institute (CLSI) subsequently developed the EP21A guidance document using that approach (3).
This direct estimation approach requires a minimum of 120 patient samples, making it useful primarily for manufacturers that perform extensive validation studies for new methods. For clinical laboratories, Center for Medicare and Medicaid Services' guidance for meeting the CLIA regulations recommends a minimum of 20 control samples to estimate precision and the same number of patient samples to verify a manufacturer’s claim for bias. Consequently, it is more practical to make an initial estimate of TAE by combining results from the replication and comparison of methods experiments. Laboratories may also choose to make ongoing estimates by using long-term SQC data and periodic estimates of bias from proficiency testing (PT) or external quality assessment surveys (EQAS).
Today, assay manufacturers generally make claims for precision and bias but not for TAE. Therefore, clinical laboratories must make individual estimates of precision and bias to verify manufacturers’ claims, with the exception of tests categorized by FDA as waived. For these tests, the agency recommends that manufacturers objectively evaluate each new method and device by establishing a criterion for the ATE before beginning clinical studies (4).
FDA currently recommends that manufacturers evaluate TAE as "the combination of errors from all sources, both systematic and random, often expressed in terms of an interval that contains a specified proportion (e.g., 95%) of the observed differences between the working method and the comparative method." The agency further recommends at least 120 patient sample comparisons for each of three decision level concentrations, which means that manufactures must perform a total of 360 patient comparisons.
Goals for Allowable Total Error
Given that ATE is intended to be an estimate of the quality of a measurement procedure, its practical value depends on a comparison to the quality required for the intended use of a test result. In other words, the definition refers to the amount of error that is allowable without invalidating the interpretation of a test result.
Laboratory professionals can find recommendations for ATE within many national and international PT and EQA programs. In addition, Ricos and colleagues in Spain (5) have developed a database of biologic goals. Available at www.westgard.com, this database includes more than 300 measurands based on published studies of biologic variation. It also provides recommendations for allowable SDs, biases, and biologic total errors, in accordance with Fraser’s guidelines for combining allowable SDs and biases (6).
Operating Specifications
While laboratory professionals have no trouble setting a goal for the ATE of an assay, achieving that goal is a different story. The latter requires a practical strategy that can be implemented in the real world. For example, the College of American Pathologists’ (CAP) criterion for acceptable performance in a proficiency testing survey is 7.0% for HbA1c. To achieve that goal, laboratories must select a method that has appropriate stable performance in terms of precision and bias and apply the right SQC to detect analytic problems that cause instability.
We use the term "operating specifications" to describe the allowable precision and bias for a measurement procedure and the SQC, which includes control rules and the number of control measurements necessary to monitor performance at the bench level and assure that the lab achieves a defined quality goal.
This approach is consistent with ISO 15189 requirements (7):
5.5.1.1 "the laboratory shall select examination procedures which have been validated for their intended use" and
5.6.2.1 "the laboratory shall design quality control procedures that verify the attainment of the intended quality of results."
As used by ISO here, intended use and quality of results describe quality goals or requirements. Such quality goals are meant to guide selection of methods and design of SQC procedures. An appropriate combination of precision, bias, and SQC becomes the ultimate strategy for achieving a defined quality goal.
Application Tools
For waived tests, FDA requires manufacturers to define ATE and to estimate TAE, but the CLIA regulations do not require laboratories to verify or validate method performance or to perform SQC, unless specified in the manufacturer’s directions. For non-waived tests, which comprise the majority of testing in clinical laboratories, CLIA regulations also require that laboratories verify manufacturers’ performance claims for precision and bias, implement a minimum SQC procedure with two levels of controls per day, and successfully perform in periodic PT surveys.
We believe a more optimum system would require quality defined ATE goals for all methods, waived and non-waived. In addition, laboratories would also be required to participate in PT for all methods, including waived methods. For now, laboratories would be well advised to implement more optimal management of analytical quality by defining their own quality goals and using some of the following tools.
Sigma metrics. While the original recommendation for a total error criterion was ATE ≥ bias + 2 SD, later papers recommended ATE ≥ bias + 4 SD (8) and, with adoption of Six Sigma concepts (9), suggested ATE ≥ bias + 5 SD and ATE ≥ bias + 6 SD.
Applying Six Sigma tolerance limits corresponds to the laboratory limits for ATE and facilitates calculation of a sigma metric defined as, (ATE – bias)/SD or (% ATE – % bias)/% CV, to characterize test quality (Figure 2). The higher the sigma metric, the better the quality of the testing process. Industrial guidelines recommend a minimum of 3-sigma quality for a routine production process. As sigma increases, SQC becomes easier and more effective; therefore, methods with 5–6 sigma quality are preferred when laboratories employ CLIA’s minimum requirement of two levels of controls per analytic run.
Figure 2
Sigma-metric Calculation
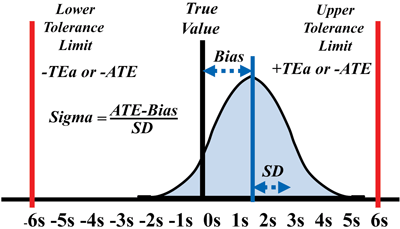 The graph shows a representation of total analytic error or total error using the terminology of the original paper: random error (RE), systematic error (SE), total analytic error (TAE or TE), bias (inaccuracy), and SD (standard deviation).
Method decision chart. A graphical tool for evaluating the quality of a laboratory test on the sigma-scale, method decision charts (10) are useful once laboratories have defined the ATE. To construct the chart, the scale of the y-axis (allowable bias) should be from 0 to the ATE value and the x-axis (allowable precision) from 0 to 0.5 ATE. The units for ATE, bias, and precision must be the same, either concentration or percentage. The lines are drawn representing the various ATE criteria by locating the y-intercept at ATE and the x-intercept at ATE/m, where m is the multiple of the SD or CV in the total error criterion.
Figure 3 shows an example of a method decision chart for HbA1c based on the CAP PT criterion of 7.0%. To assess the quality of a method, the laboratory should plot an operating point representing the observed bias as the y-coordinate and the observed SD or CV as the x-coordinate. For example, an HbA1c method with a bias of 1.0% and CV of 1.5% is shown as point A in Figure 3 and falls on the line corresponding to 4 sigma. To confirm this is correct, the laboratory should also calculate the sigma metric, where sigma = (7.0 – 1.0)/1.5 = 4.0.
Figure 3
Example of Method Decision Chart
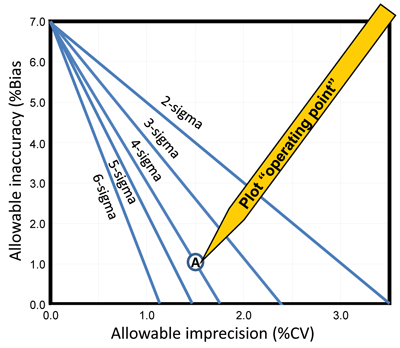 This example of a methods decision chart shows allowable total error (ATE) using HbA1c and the CAP PT criterion of 7%. Allowable inaccuracy (% bias) is plotted on the y-axis versus allowable imprecision (% CV) on the x-axis. Diagonal lines represent, from left to right, 6-sigma, 5-sigma, 4-sigma, 3-sigma, and 2-sigma quality. Operating point (A) shows a method having a bias of 1.0% and a CV of 1.5% that demonstrates 4-sigma quality.
Sigma SQC selection graph. Using SQC procedures, laboratories can employ statistical methods to monitor and evaluate systems, including several charting procedures for visually evaluating the consistency of key processes and identifying unusual circumstances that might merit attention. Using what is known as a power curve, it is possible to show the probability for rejection in relation to the size of the error that occurs. Figure 4 provides power curves for several different SQC procedures and shows as an example a sigma of 4.0. As expected, probability for error detection (Ped) increases as the error gets larger, the number of control measurements increase, and more control rules are put in place. The probability for false rejection (Pfr) also increases slightly, as shown by the y-intercepts of the power curves.
An appropriate SQC procedure provides a high Ped for medically important errors and a low Pfr. Laboratories can also calculate the size of the medically important systematic error, called the critical systematic error (DSEcrit), from the quality goal for the test and the bias and precision of the method using the formula: DSEcrit = [(ATE – bias)/SD] – 1.65, where the factor 1.65 is chosen to minimize the risk of erroneous test results at 5%. Note that the term (ATE – bias)/SD represents the sigma-metric for the testing process, which means that Sigma = DSEcrit + 1.65. That relationship allows the graph to be rescaled in terms of sigma, as shown by the horizontal scale at the top in Figure 4. To select an appropriate SQC procedure, the laboratory draws a vertical line corresponding to the sigma metric of the testing process. For this example, the laboratory could select either a 12.5s single-rule with N=4 or a 13s/22s/R4s/41s multi-rule procedure with N=4. Directions for using this sigma-metrics tool to select a SQC procedure can be found in CLSI C24A3 (11).
Figure 4
Example of a Sigma SQC Selection Graph
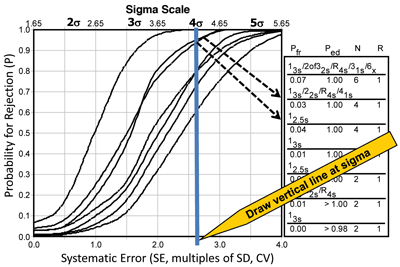 The probability for rejection is shown on the y-axis versus the size of systematic error on the lower x-axis (given in multiples of the SD or CV) and the sigma-metric of the method on the upper x-axis. The curves represent different SQC procedures, top to bottom, as shown in the key at the right, top to bottom. Vertical line represents a method having 4-sigma quality and illustrates selection of SQC procedures that have a total of four control measurements per run.
Chart of operating specifications. This tool relates the precision and bias observed for a method to the desired SQC, employing the same format as the method decision chart. It uses mathematical equations in the form of "error budgets" to describe the relationship between the various error components and the defined quality goal. The starting point is the total error budget that is composed of bias plus a multiple of the SD or CV. Adding a factor that characterizes the sensitivity of the SQC procedure provides an analytical quality planning model (12). Further expansion to include pre-analytic variables and account for within-subject biologic variation provides a clinical quality planning model (13) that relates medically important changes in test results to precision, accuracy, and SQC.
Figure 5 shows how laboratories can display the results of these models, known as an OPSpecs chart. This chart uses a defined quality goal and displays the allowable bias on the y-axis versus the allowable SD or CV on the x-axis. An operating point represents the observed method bias as the y-coordinate and observed method imprecision as the x-coordinate. The lines on the chart show the allowable regions for the different SQC procedures.
Any line above the operating point identifies an SQC procedure that will provide at least a 90% chance of detecting medically important systematic errors. The control rules and number of control measurements are identified in the key at the right, where the lines on the chart, top to bottom, match those in the key, top to bottom. For example, an HbA1c method that has a bias of 1.0% and a CV of 1.5%, as shown by point A, can be effectively controlled by a 12.5s single-rule procedure with N=4 or a 13s/22s/R4s/41s multi-rule procedure with N=4.
Figure 5
Example of an OPSpecs Chart
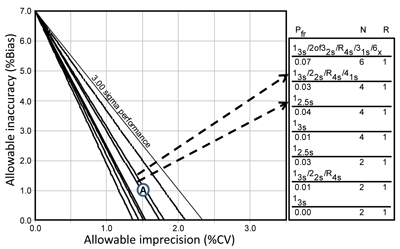 This example of a chart of operating specifications uses HbA1c with the CAP PT criterion of 7.0%. Allowable inaccuracy (% bias) is shown on the y-axis versus allowable imprecision (% CV) on the x-axis. The lines below the 3.0 sigma line represent different SQC procedures, as identified in the key at the right. Point A shows a method having a 1.0% bias and 1.5% CV and illustrates the selection of SQC procedures that have a total of 4 control measurements per run.
Normalized method decision and OPSpecs charts. Preparing method decision and OPSpecs charts for each test’s defined error goal is challenging. Alternatively, laboratories may also choose to prepare normalized charts that are scaled from 0–100% on the y-axis and 0–50% on the x-axis. The coordinates of the operating point are then calculated as a percent of the defined error goal. For example, a method with ATE of 7%, bias of 1.0%, and CV of 1.5% would have a y-coordinate of 14% and x-coordinate of 21%.
The advantage of normalized charts is that different tests with different quality requirements can be presented on the same chart. For example, a point-of-care glucose (ATE=15%), a laboratory glucose (ATE=10%), and an HbA1c (ATE=7%) could all be presented on the same method decision or OPSpecs chart. Moreover, the laboratory could present all tests on a multi-test analyzer on the same chart.
Achieving Quality in Laboratory Testing
As laboratorians, our mission is to provide accurate and useful information for clinicians to use in making patient diagnostic and treatment decisions. Understanding how to set quality goals for tests and how to achieve those goals is essential to that mission.
This review has only skimmed the surface of the TAE and ATE concepts. A more detailed version of this article is posted online, with links to other discussions of quality goals, tables of quality goals, additional example applications, and more extensive references.
REFERENCES
- Westgard JO, Carey RN, Wold S. Criteria for judging precision and accuracy in method development and evaluation. Clin Chem 1974;20:825–33.
- Krouwer JS. Estimating total analytical error and its sources. Arch Pathol Lab Med 1992;116:726–31.
- Clinical and Laboratory Standards Institute (CLSI). Estimation of total analytical error for clinical laboratory methods. CLSI EP21-A 2003.
- Food and Drug Administration, Center for Devices and Radiological Health, Office of In Vitro Diagnostic Device Evaluation and Safety. Guidance for industry and FDA staff: Recommendations for clinical laboratory improvement amendments of 1988 (CLIA) waiver applications for manufacturers of in vitro diagnostic devices. 2008.
- Ricos C, Alvarez F, Cava JV, et al. Current databases on biological variation: Pros, cons, and progress. Scand J Clin Lab Invest 1999;59:491–500.
- Fraser CG. Biological variation: From principles to practice. Washington, D.C.: AACC Press; 2001.
- International Organization for Standardization (ISO). Medical laboratories—Requirements for quality and competence. International Standard 15189:2012. 3rd Ed. 2012.
- Westgard JO, Burnett RW. Precision requirements for cost-effective operation of analytical processes. Clin Chem 1990;36:1629–32.
- Westgard JO. Six sigma quality design and control: Desirable precision and requisite QC for laboratory measurement processes. Madison, Wis.:Westgard QC; 2001.
- Westgard JO. Basic method validation, 3rd ed. Madison, Wis.:Westgard QC; 2008.
- Clinical and Laboratory Standards Institute (CLSI). Statistical quality control for quantitative measurement procedures: Principles and definitions. CLSI C24A3 2006.
- Westgard JO. Charts of operational process specifications ("OPSpecs Charts") for assessing the precision, accuracy, and quality control needed to satisfy proficiency testing criteria. Clin Chem 1992;38:1226–33.
- Westgard JO, Hyltoft Petersen P, Wiebe DA. Laboratory process specifications for assuring quality in the U. S. National Cholesterol Education Program. Clin Chem 1991;37:656–61.
- Westgard JO. Managing quality vs. measuring uncertainty in the medical laboratory. Clin Chem Lab Med 2010;48:31–40.
James O. Westgard, PhD, is emeritus professor, Department of Pathology and Laboratory Medicine, University of Wisconsin, Madison, and principal of Westgard QC, Inc., Madison.
Sten A. Westgard , MS, is principal, Westgard QC, Inc., Madison, Wisc.
Disclosures: The authors receive salary/consultant fees and stocks/bonds from Westguard QC, Inc.